US Housing Starts Ease 5.2 Percent to 1.221 Million While Permits Barely Move
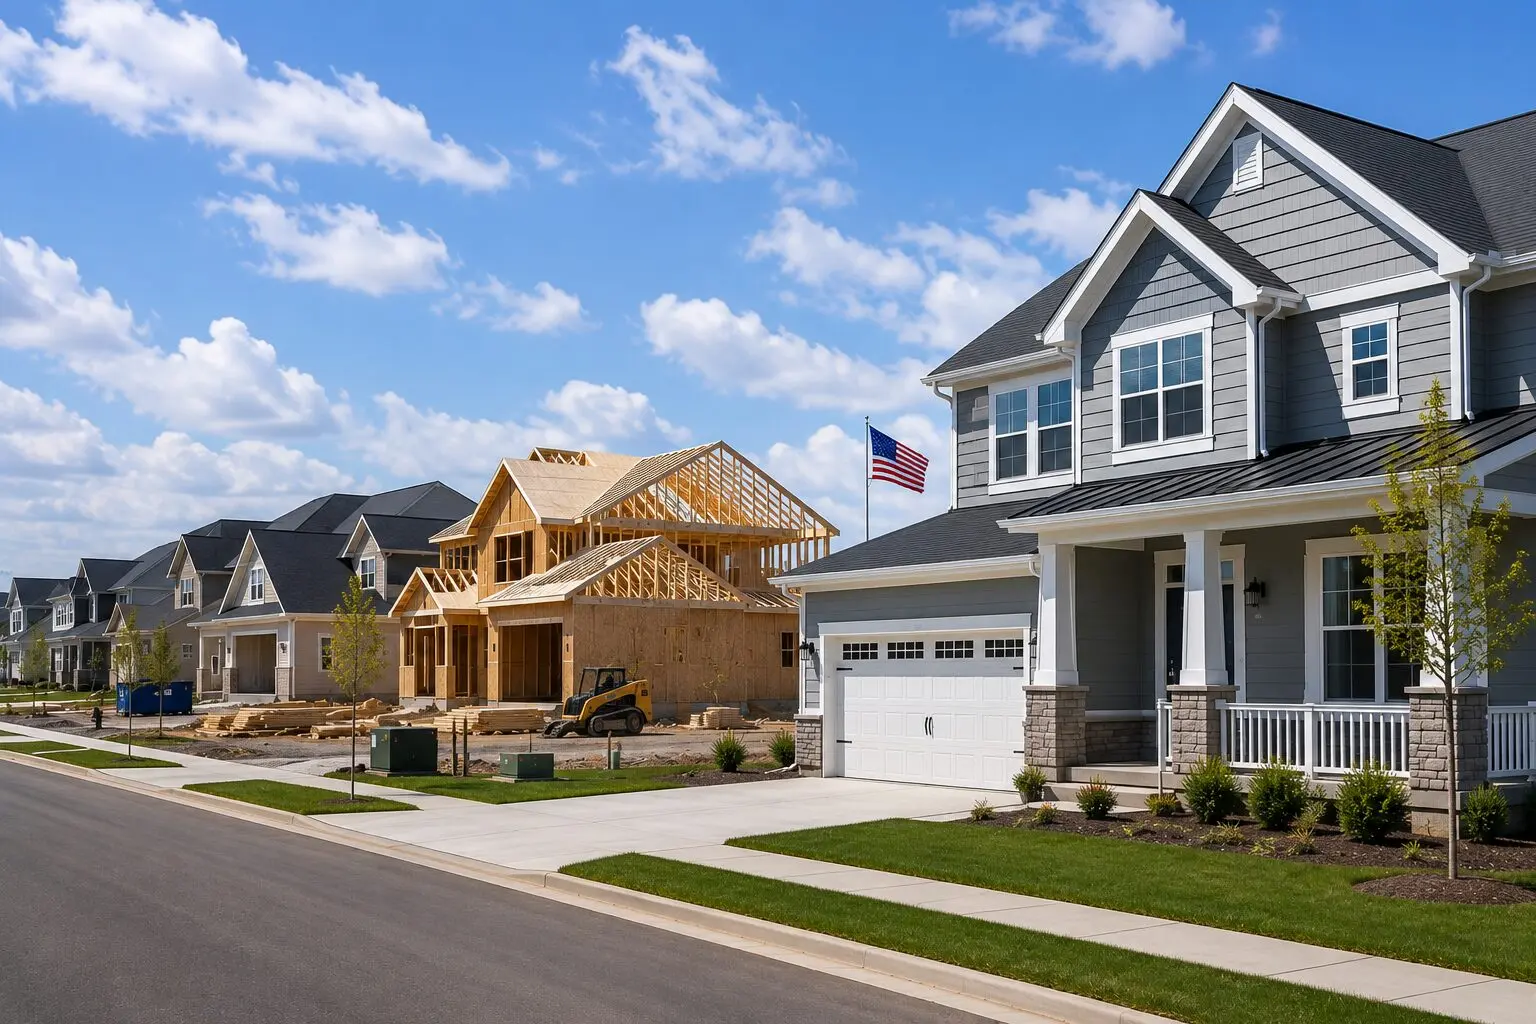
US housing starts eased 5.2 percent in September to a seasonally adjusted annual rate of 1,221,000, the US Census Bureau and the Department of Housing and Urban Development said on 20 October. The revised August rate was 1,288,000. The bureau’s 90 percent confidence range for the change is plus or minus 11.8 percent. That range includes zero, so the bureau marks the fall as not statistically significant. Building permits, which come before starts, slipped 0.2 percent to 1,400,000.
September 2026 against August and a year earlier
| Series | September | On August | On September 2025 |
|---|---|---|---|
| Building permits | 1,400,000 | -0.2% | -3.0% |
| Housing starts | 1,221,000 | -5.2% (±11.8) | -7.4% (±11.5) |
| Housing completions | 1,192,000 | +2.2% (±10.8) | -14.0% (±11.1) |
| Under construction | 1,280,000 | 0.0% (±0.9) | -3.3% (±2.7) |
Seasonally adjusted annual rates; units under construction are a seasonally adjusted count at the end of the month. Figures in brackets are 90 percent confidence intervals: where the interval includes zero, the change is not statistically significant. Permits carry no interval because they come from a non-probability sample that is not subject to sampling error.
Permits run 179,000 ahead of starts
Permits outpaced starts by 179,000 units in September, on our calculation. That puts permits 14.7 percent above starts on our calculation, against 8.9 percent in August. The bureau’s notes say it may take three months to see a trend in permits. The latest three months averaged 1,412,000, up 0.7 percent on the three before, on our calculation.
The pile of approved homes not yet started is larger than a year ago. Units authorized but not yet started reached 279,000 at the end of September, from 278,000 in August. That is 25,000 more than a year earlier, a rise of 9.8 percent on our calculation. It is also the highest month-end level since January 2025, when it stood at 282,000, on our reading of the monthly series. Single-family homes made up 151,000 of that backlog, level with August and the highest in the 21 months from January 2025, on our reading.
Single-family permits fell 4.0 percent to 845,000. That is the lowest of the 21 monthly readings since January 2025, on our reading. Single-family starts ran 14,000 above those permits, on our calculation.
Starts in larger buildings drop 25.9 percent on the year
Buildings with 5 units or more started at a rate of 349,000. That is 7.2 percent below August. On our reading, the move is not statistically significant, because its confidence range of plus or minus 27.7 percent includes zero. The yearly fall is a different matter. The segment is down 25.9 percent on September 2025. That decline is larger than its margin of plus or minus 21.5 percent, so it is statistically significant on our reading.
Permits for the same buildings rose 5.9 percent to 503,000. Starts equalled 69.4 percent of those permits, on our calculation, leaving a gap of 154,000 units.
Single-family starts slipped 4.6 percent on the month to 859,000. They stood 2.6 percent above September 2025. Neither change is statistically significant, on our reading. Houses made up 70.4 percent of all starts on our calculation, against 69.9 percent in August.
On our reading, the year-to-date count is steadier than the monthly rate. Unadjusted starts for January to September totalled 1,036,500. That is 1.1 percent fewer than a year earlier, a change that is not statistically significant on our reading. Single-family starts are down 4.0 percent over the same nine months. That fall is statistically significant on our reading, since its margin is only plus or minus 3.2 percent. Starts in buildings of 5 units or more are up 6.9 percent, which is not significant on our reading.
The South rises while the West falls
Housing starts by region, September 2026
| Region | September | On August | On September 2025 |
|---|---|---|---|
| South | 714,000 | +6.1% (±15.5) | +11.0% (±20.4) |
| West | 235,000 | -23.2% (±22.9) | -25.4% (±14.3) |
| Midwest | 158,000 | -19.0% (±20.7) | -19.4% (±21.0) |
| Northeast | 114,000 | 0.0% (±34.2) | -30.9% (±32.1) |
Seasonally adjusted annual rates, ranked by September level. Brackets show 90 percent confidence intervals. Average relative standard errors are 8 percent for the South, 11 percent for the West and the Midwest and 17 percent for the Northeast, against 6 percent for the national total.
The South accounted for 58.5 percent of national starts in September, on our calculation. It was the only region to post a rise, on our count. The West’s monthly drop of 23.2 percent and annual drop of 25.4 percent are the only regional changes whose intervals exclude zero, on our reading. At 235,000, Western starts were the lowest in the 21 months since January 2025, on our reading.
Permits moved the same way as starts in the West and the South, on our reading. Western permits fell 10.2 percent to 283,000. They are 11.3 percent below a year earlier. Northeastern permits rose 13.3 percent to 145,000. The South issued permits at a rate of 759,000, or 54.2 percent of the national total on our calculation.
Completions are 14.0 percent lower on the year
Completions rose 2.2 percent on the month to 1,192,000, a change that is not statistically significant on our reading. The annual comparison is firmer. Completions are 14.0 percent below September 2025. On our reading, that drop is statistically significant, as it is larger than its margin of plus or minus 11.1 percent. Single-family completions came in at 840,000, down 11.0 percent on the year and also significant on our reading. That is the lowest single-family completion rate in the 21 months since January 2025, on our reading.
The bureau’s notes say it may take six months to see a trend in starts and completions. Starts averaged 1,319,000 from April to September, 3.8 percent below the previous six months, on our calculation. Completions averaged 1,295,000, 8.2 percent below the previous six months, on our calculation. For the full calendar year 2025, completions totalled 1,488,500 units, 8.5 percent fewer than in 2024, on our calculation.
Units under construction stood at 1,280,000 at the end of September, unchanged from August. That is 3.3 percent fewer than a year earlier, a decline that is statistically significant on our reading. It is also 23.4 percent below the 1,670,000 under way in January 2024, on our calculation. Buildings of 5 units or more account for 677,000 of the homes under construction, or 52.9 percent on our calculation. Starts ran 29,000 above completions in September, on our calculation.
Why it matters: On our reading, September points to delay more than retreat in US homebuilding. Permits barely moved, and the stock of approved homes not yet started is the highest since January 2025, on our reading. Completions, the homes buyers and renters can move into, are 14.0 percent below a year ago, a decline that is statistically significant on our reading.
Outlook: The bureau publishes revised September permits on 27 October at 12:00 GMT and September new home sales the same day at 14:00 GMT. October starts and permits follow on 18 November at 13:30 GMT. The first test is whether more of the 279,000 approved homes not yet started break ground. The second is whether Western starts fall for a second month.
Sources: US Census Bureau, US Department of Housing and Urban Development, The Edge.