Jordan’s Factory Gate Prices Rose 6.62 Percent in the Year to May
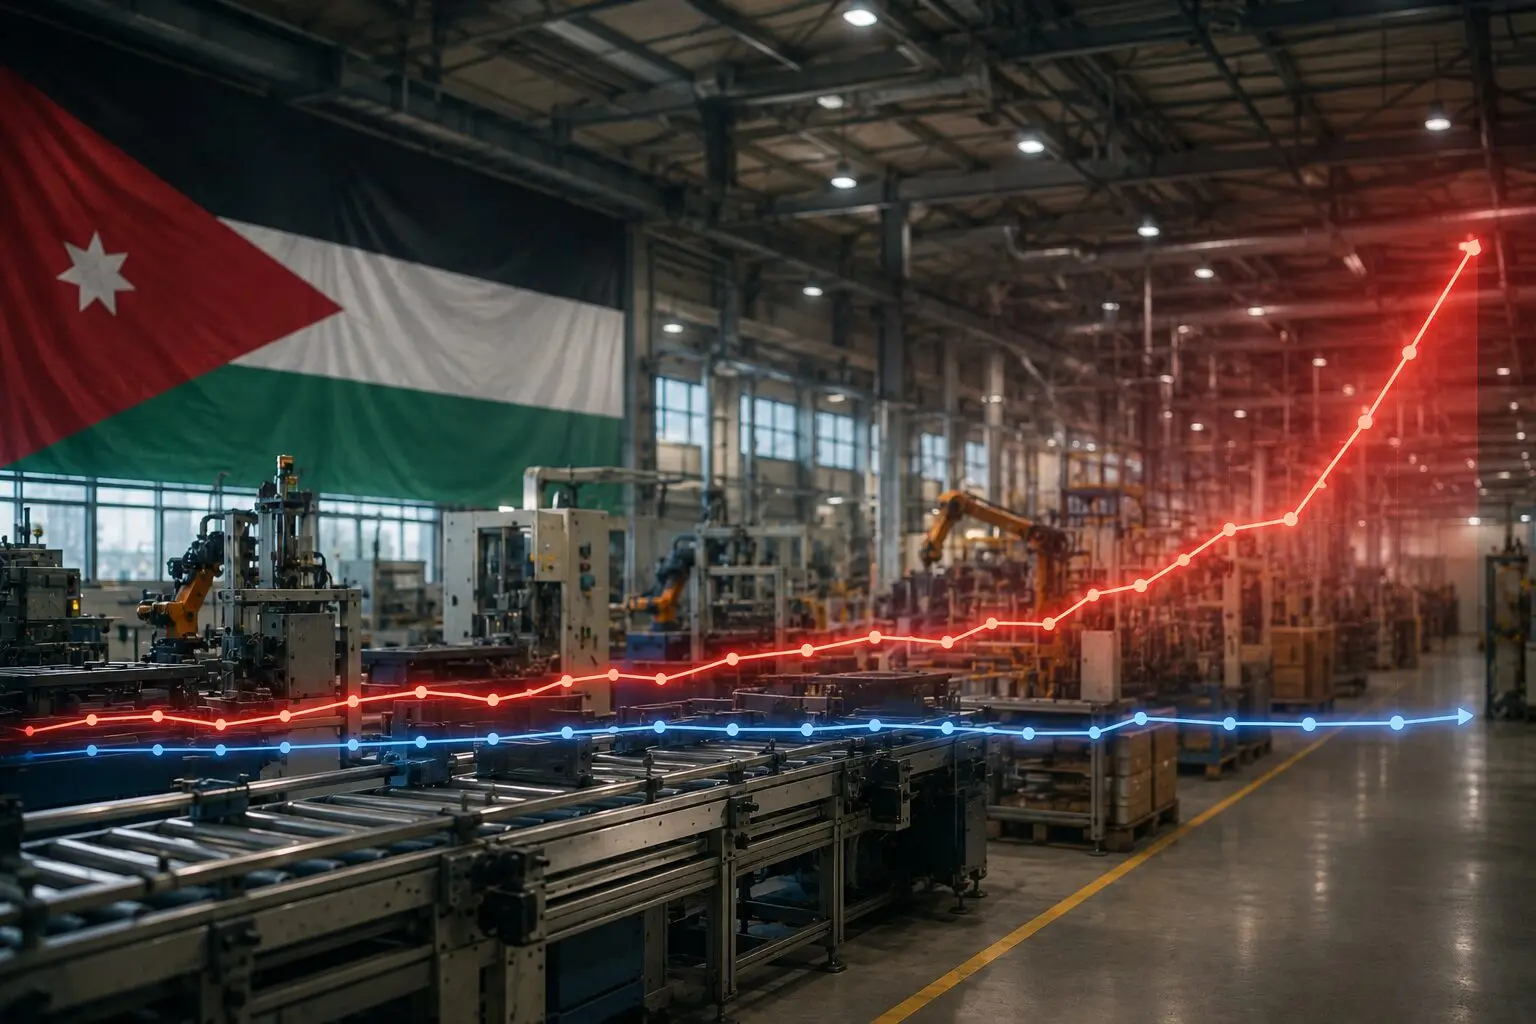
Two releases from Jordan’s Department of Statistics describe an industrial sector whose costs turned sharply upward in a single month after being negative for most of the year. The Producer Price Index rose 6.62 percent in May 2026 against May 2025, the Department reported on 23 July, alongside a monthly gain of 0.60 percent. The Industrial Production Index rose 0.34 percent over the same twelve months, the Department reported on 26 July, with a monthly rebound of 4.68 percent. Read together, the two series show an industrial economy expanding in value and standing still in volume.
The cumulative picture is the opposite of the monthly one, and this is the part that has been widely misread. Across the first five months of 2026, producer prices were 1.05 percent above the same period of 2025 while industrial output was 0.10 percent above it, and consumer prices, over exactly the same five months, were 1.88 percent higher. Cumulatively, Jordanian consumer prices have been rising faster than factory gate prices, not slower.
That reversal is explained by how the year began. Producer prices fell 2.89 percent year on year in January and 2.64 percent in February. The Department’s release of 5 July recorded the cumulative reading for the first four months at minus 0.34 percent. One month later, with May included, the same cumulative reading stands at plus 1.05 percent, a swing of 1.39 percentage points in the cumulative rate from the addition of a single month. This is a late shock, not five months of sustained pressure.
The two industrial series, May 2026
| Series | Weight in index | Year on year | Month on month | January to May |
|---|---|---|---|---|
| Producer Price Index, all industry | 100 percent | +6.62 percent | +0.60 percent | +1.05 percent |
| Manufacturing, prices | 88.74 percent | +6.43 percent | +0.27 percent | +0.71 percent |
| Quarrying, prices | 5.36 percent | +17.18 percent | +6.58 percent | +6.99 percent |
| Electricity, prices | 5.91 percent | +0.55 percent | +0.35 percent | +1.01 percent |
| Industrial Production Index, all industry | 100 percent | +0.34 percent | +4.68 percent | +0.10 percent |
| Manufacturing, volumes | 88.7 percent | +0.94 percent | +5.81 percent | −0.20 percent |
| Mining and quarrying, volumes | 5.4 percent | −6.86 percent | −7.92 percent | +2.56 percent |
| Electricity, volumes | 5.9 percent | −1.91 percent | +0.04 percent | +2.58 percent |
| Industrial Production Index level | n/a | 88.34, against 88.04 in May 2025 | 84.39 in April 2026 | 87.39 average, against 87.31 |
Input figures are from the Jordan Department of Statistics releases of 23 and 26 July 2026 and 5 July 2026. Industrial Production Index sub sector detail and index levels are carried by Petra, the Jordan News Agency. Weighted sub sector contributions may not sum exactly to the published headline rates, because the published weights and rates are themselves rounded.
The numbers behind the two series
Decomposing the price index by weight shows how concentrated the annual rise is. On our calculation, manufacturing contributed about 5.71 percentage points of the 6.62 percent increase, quarrying about 0.92 points and electricity about 0.03 points, a weighted total of 6.66 against a published 6.62, the difference being rounding in the inputs. In share terms roughly 86 percent of the rise comes from manufacturing and 14 percent from quarrying. Quarrying, at a weight of just 5.36 percent, delivered a seventh of the entire producer price increase.
The same decomposition applied to volumes runs the other way. On our calculation manufacturing contributed about 0.83 percentage points to the 0.34 percent volume increase, while mining and quarrying subtracted about 0.37 points and electricity about 0.11 points. The two smaller sectors together removed roughly 0.48 points from what would otherwise have been a manufacturing driven gain above 0.8 percent. The headline volume figure is small because it is a net figure, not because manufacturing was weak.
Combining price and volume gives a rough proxy for nominal industrial value. Multiplying the two indices produces about 7.0 percent year on year, on our calculation, of which roughly 6.6 points is price and 0.3 points is volume: approximately 95 percent of the nominal movement is price. This is an analytical construction, not an official turnover series; the two indices are compiled separately and should not be treated as a single revenue measure. At sector level, quarrying shows prices up 17.18 percent against volumes down 6.86 percent, netting to about 9.1 percent nominal on our calculation, a sector selling meaningfully less at sharply higher prices. Manufacturing shows prices up 6.43 percent against volumes up 0.94 percent, about 7.4 percent nominal.
Producer and consumer prices, compared correctly
The comparison that matters must hold the period constant, and doing so gives two answers that point in opposite directions.
| Comparison | Producer prices | Consumer prices | Difference |
|---|---|---|---|
| May 2026 against May 2025 | +6.62 percent | +2.83 percent | Producer prices ahead by 3.79 points |
| January to May 2026 against the same period of 2025 | +1.05 percent | +1.88 percent | Consumer prices ahead by 0.83 points |
On the monthly year on year measure producer prices are running about 2.3 times consumer prices, on our calculation. On the cumulative measure they are running below them. A figure of 2.03 percent has circulated as Jordan’s inflation rate; it is from the Department’s 23 July consumer price release and measures the first half of 2026 against the first half of 2025. The June year on year rate in that same release is 2.79 percent, and June rose 0.14 percent on May. The correct partner for the May producer price series is the Department’s consumer price release of 18 June, which covers May.
What the two readings together describe is a producer price series that spent the early months of the year below its 2025 level and has now crossed sharply above it. Whether that resolves through pass through, in which case consumer inflation drifts up over the second half, or through absorption, in which case industrial margins compress, is the single most useful thing to watch in Jordan’s second half data, and the monthly producer series will signal it before the consumer series does.
Why it matters: For regional investors and for Jordanian industrial exposure, the composition matters more than the headline. An economy whose industrial value is rising almost entirely on price rather than volume is not expanding capacity, and the concentration of the price rise in quarrying, a sector whose volumes are falling at close to 7 percent year on year, points to supply constraint rather than demand strength. Manufacturing, which carries almost 89 percent of both indices, is the more reassuring part of the picture: volumes up, prices up moderately, and a strong monthly rebound of 5.81 percent. But its cumulative volume reading remains marginally negative at −0.20 percent, which caps how much comfort to take from one month. The cumulative comparison also argues against reading May as evidence of an inflation problem originating in industry: for the year to date, Jordanian producers have raised prices by less than Jordanian consumers have paid.
Outlook: Three things to watch through the second half. First, whether quarrying volumes recover, which would confirm the price spike as a temporary supply effect rather than a structural one. Second, whether the June producer price release sustains May’s level or gives it back, which decides whether the cumulative reading keeps climbing toward the consumer series or falls away from it. Third, whether manufacturing’s cumulative volume reading crosses back above zero, which on current momentum it plausibly does in the June or July data.
Sources: Jordan Department of Statistics, producer price, industrial production and consumer price releases, June and July 2026; Petra, the Jordan News Agency. Derived calculations are our own.