China’s Current Account Surplus Jumps to $276.1 Billion in Third Quarter

The Takeaway: China’s current account surplus reached $276.1 billion in the third quarter, up from the second quarter, according to preliminary balance of payments data from the country’s foreign exchange regulator. A wider goods surplus did the work, while the services deficit widened, with travel spending abroad its largest part. On the financial side, reserve assets increased and net foreign direct investment into China turned slightly negative, while Chinese direct investment abroad continued.
A goods surplus of $350.1 billion, the largest of the three quarters so far this year, lifted China’s current account surplus to $276.1 billion in the July to September quarter.
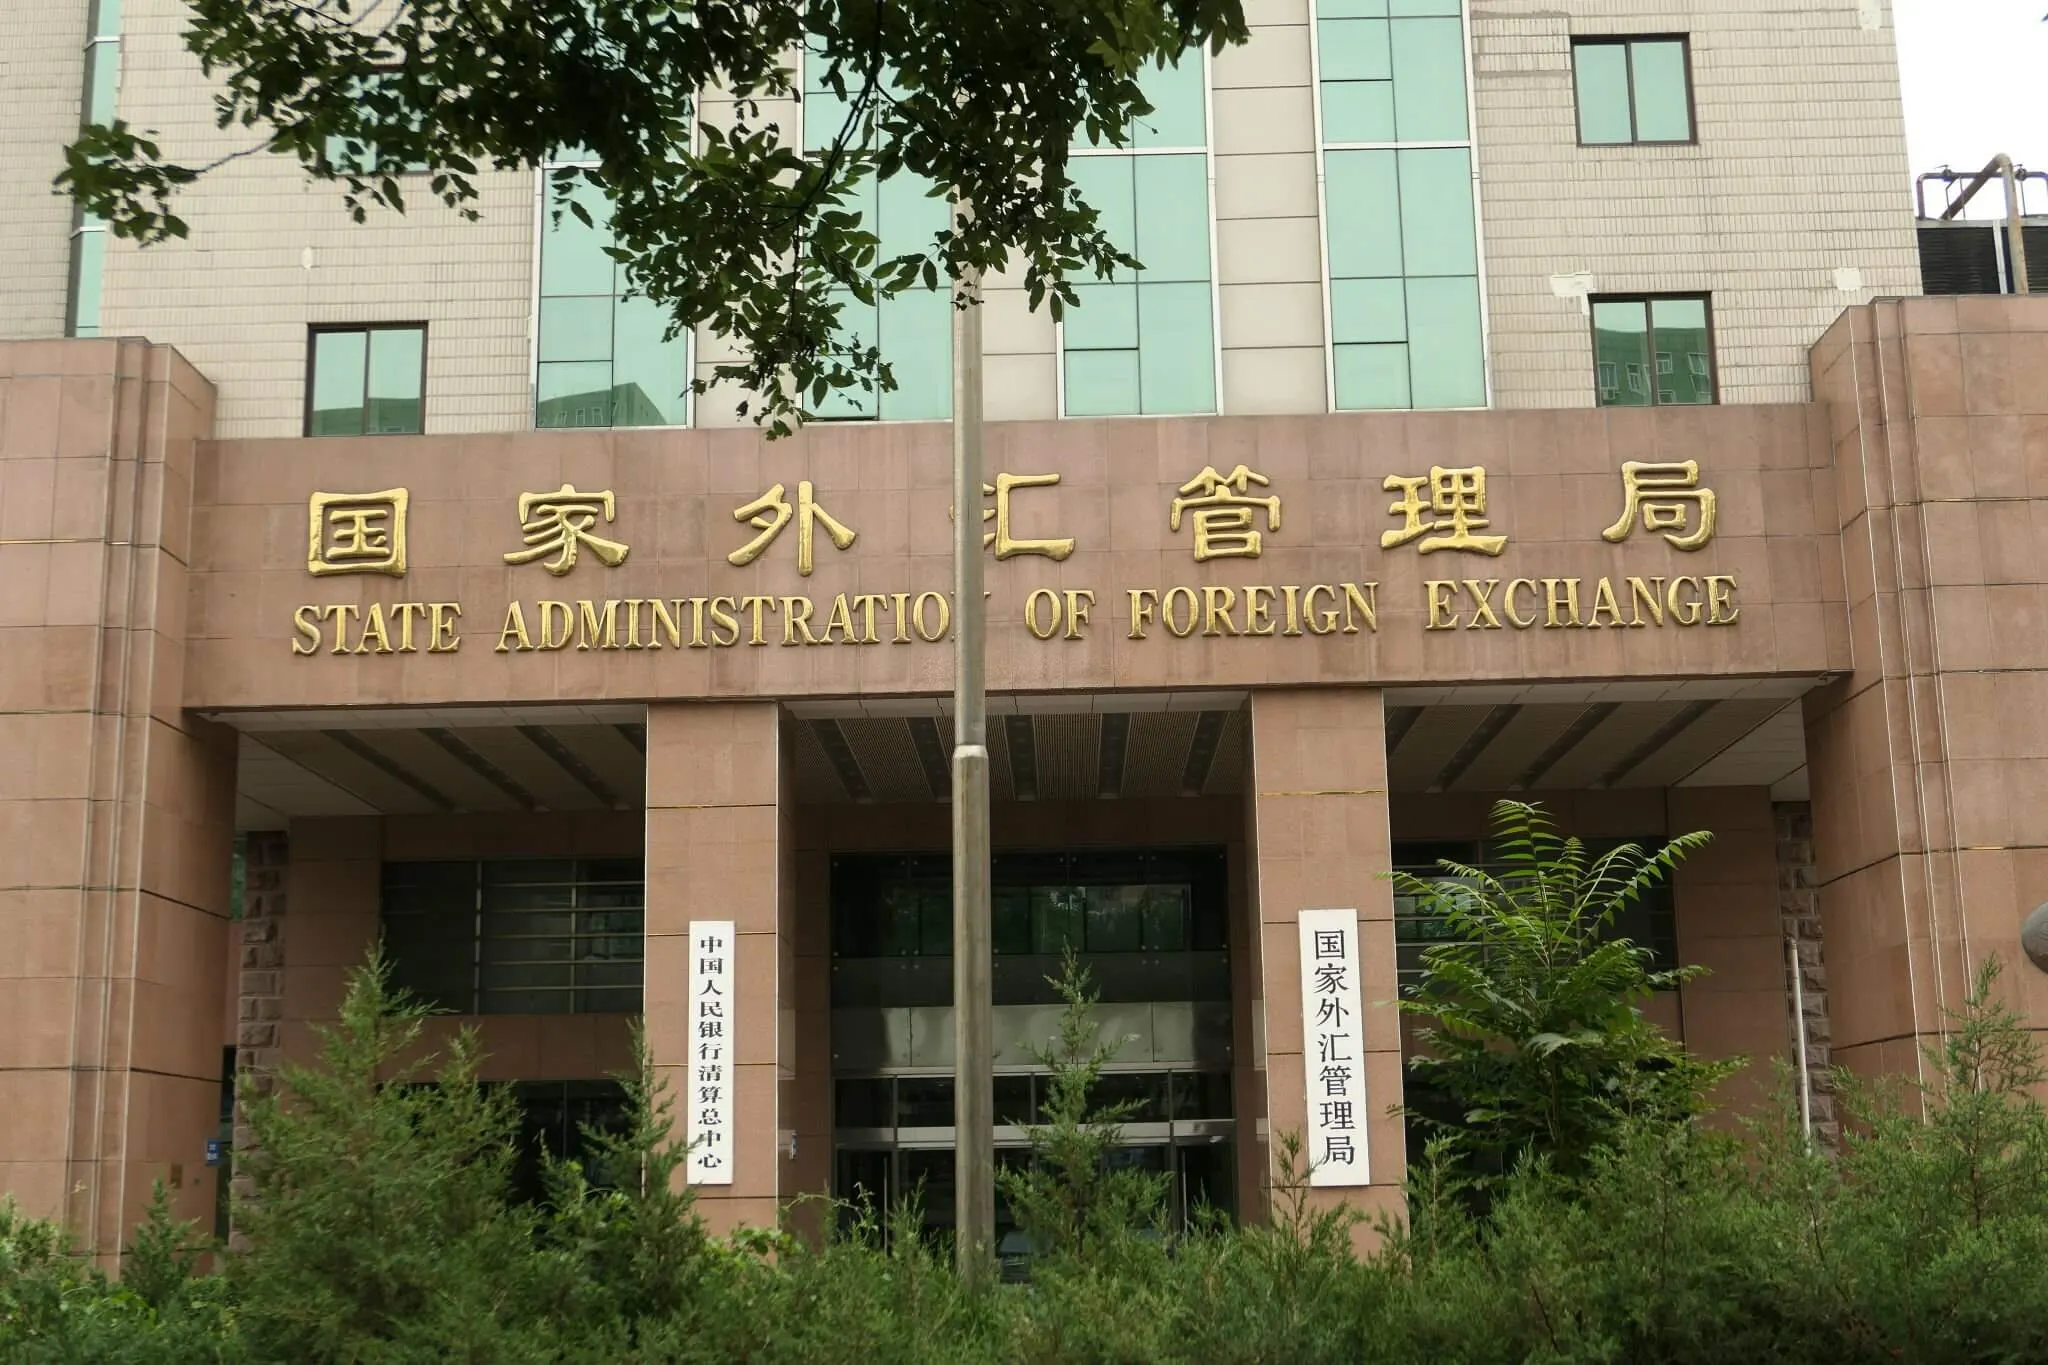
The surplus on the current account, the broadest measure of a country’s trade and income flows with the rest of the world, was up 42.5% from $193.7 billion in the second quarter. The State Administration of Foreign Exchange (SAFE), the country’s foreign exchange regulator, published the preliminary figures on Friday.
In yuan terms, the quarterly surplus came to 1,872.2 billion yuan. Measured in special drawing rights, the International Monetary Fund’s reserve unit, it was 202.3 billion SDRs.
Goods trade drives the gain on the quarter
Goods exports reached $1,213.3 billion in the quarter, counted on a balance of payments basis, the International Monetary Fund’s statistical standard that the regulator’s tables follow. Imports came to $863.2 billion.
The resulting goods surplus widened by $71.3 billion from the second quarter’s $278.8 billion.
Over the same span, a narrower income deficit added to the gain, while a wider gap in services took from it.
The table below sets out the main components of the current account in the quarter, against the previous quarter.
China’s current account, by component ($ billion)
| Component | Q3 2026 | Q2 2026 |
|---|---|---|
| Current account | 276.1 | 193.7 |
| Goods | 350.1 | 278.8 |
| Services | -63.9 | -55.4 |
| Primary income | -16.8 | -35.9 |
| Secondary income | 6.7 | 6.3 |
Third quarter of 2026 preliminary; second quarter of 2026 as revised on 29 September 2026. Components may not add up because of rounding.
Travel leads the services gap as the income deficit narrows
Trade in services ran a deficit of $63.9 billion, wider than the second quarter’s $55.4 billion.
Travel was by far the largest item. It accounted for $46.8 billion of the services deficit, about 73% of it.
Travel debits, what residents spend while abroad, reached $61.3 billion, against receipts from visitors of $14.6 billion.
Transport services added a deficit of $18.0 billion. Charges for the use of intellectual property, the royalties and license fees paid for patents, brands and software, cost a net $8.3 billion.
Some services earned a surplus. Telecommunications, computer and information services brought in a net $6.2 billion, and construction services $2.8 billion.
The primary income deficit, the net of investment income and wages paid and received across borders, narrowed to $16.8 billion from $35.9 billion in the second quarter.
Primary income receipts of $101.9 billion fell short of payments of $118.7 billion. Secondary income, transfers such as remittances and aid that carry no exchange of value, showed a surplus of $6.7 billion.
Nine months show a surplus a third larger
Over the first three quarters, the current account surplus reached $654.1 billion. That was 33.2% more than in the same period of 2025.
The goods surplus for the nine months came to $876.4 billion, up 16.8% on the year.
The services deficit narrowed to $178.8 billion from $189.6 billion. Travel accounted for $136.7 billion of it.
The primary income deficit narrowed to $60.2 billion from $84.6 billion. The third quarter alone supplied about 42% of the nine-month current account surplus.
Last year’s nine-month figures rest on the revised 2025 totals the regulator published on 27 March, when it revised its quarterly balance of payments data back to 2019.
The first quarter’s surplus works out at $184.3 billion, based on the regulator’s first-half total and its second-quarter figure. The quarterly surplus has risen in each period since.
These are preliminary figures. SAFE revised the second quarter’s current account surplus to $193.7 billion, from the $195.1 billion it first published on 14 August.
The services deficit in that quarter was raised to $55.4 billion from $52.4 billion. The second-quarter figures set out here on 30 September came from that revised release.
The nine-month totals combine official figures for the first two quarters with the preliminary third quarter. Last year, the official third-quarter figures came out on 31 December.
Reserves rise and direct investment flows out
The capital and financial account, which records cross-border investment and lending and here includes the quarter’s net errors and omissions, the gap left by incomplete recording, showed a deficit of $276.1 billion. It is the mirror image of the current account surplus because, by accounting identity, a current account surplus is matched by net lending to the rest of the world.
Reserve assets, the foreign assets China’s monetary authorities control and can deploy, rose by $47.9 billion through transactions in the quarter. Almost all of the increase, $47.4 billion, was in foreign exchange reserves.
In the second quarter, reserve assets had increased by $74.6 billion. Over the first three quarters, they rose by $170.5 billion, against a fall of $52.5 billion in the same period of 2025.
Transaction flows differ from the reserve stock, which also moves with exchange rates and asset prices. Foreign exchange reserves stood at $3,405.2 billion at the end of October, as set out here on 7 November.
Direct investment, stakes of the kind that give an investor lasting influence over a company, showed a net outflow of $31.9 billion. Chinese direct investment abroad accounted for $31.0 billion of it.
Foreign direct investment liabilities in China fell by a net $0.9 billion, after a $26.6 billion rise in the second quarter. Gross new equity from foreign direct investors, excluding reinvested earnings, still came to $18.0 billion, a note to the table shows.
Over nine months, foreign direct investment liabilities rose a net $60.0 billion. In the same period of 2025, the rise was $33.6 billion.
The table below sets out the main financial flows in the quarter.
China’s direct investment and reserve flows ($ billion)
| Item | Q3 2026 | Q2 2026 |
|---|---|---|
| Direct investment, net | -31.9 | -7.0 |
| Direct investment assets | -31.0 | -33.6 |
| Direct investment liabilities | -0.9 | 26.6 |
| Reserve assets | -47.9 | -74.6 |
Following the regulator’s presentation, a negative figure for assets is an increase in holdings abroad, and a negative figure for liabilities is a decrease. The third quarter of 2026 is preliminary.
In The Edge’s reading, the quarter is a goods story: the wider goods surplus supplied $71.3 billion of the $82.4 billion rise in the current account surplus from the second quarter, and a narrower primary income deficit more than offset the wider services gap. Where the money went is less clear, because the preliminary release does not break down the remaining $196.4 billion, which covers portfolio investment, derivatives, other investment and the quarter’s net errors and omissions.
Method: figures are from the State Administration of Foreign Exchange’s preliminary balance of payments for the third quarter and the first three quarters of 2026, released on 13 November 2026 in English and Chinese, and its official balance of payments for the second quarter and first half of 2026 of 29 September 2026, its preliminary second-quarter release of 14 August 2026 and its balance of payments for the fourth quarter and full year of 2025 of 27 March 2026, which revised quarterly data back to 2019; end-October reserves are from its release of 7 November 2026. Figures in the regulator’s tables are in units of 100 million dollars and are shown here in billions. Changes, shares, the first-quarter figure (first-half total less the second quarter), the nine-month 2025 figures (the revised 2025 totals less the revised fourth quarter, both from the release of 27 March 2026) and the residual (the financial account excluding reserves but including the quarter’s net errors and omissions, less direct investment) are ours. Signs follow the regulator’s presentation under the IMF’s sixth balance of payments manual.
Sources: State Administration of Foreign Exchange, The Edge.