European Bank Results: Societe Generale Lifts Q3 Net Income 24.1%, ING Up 3.5%
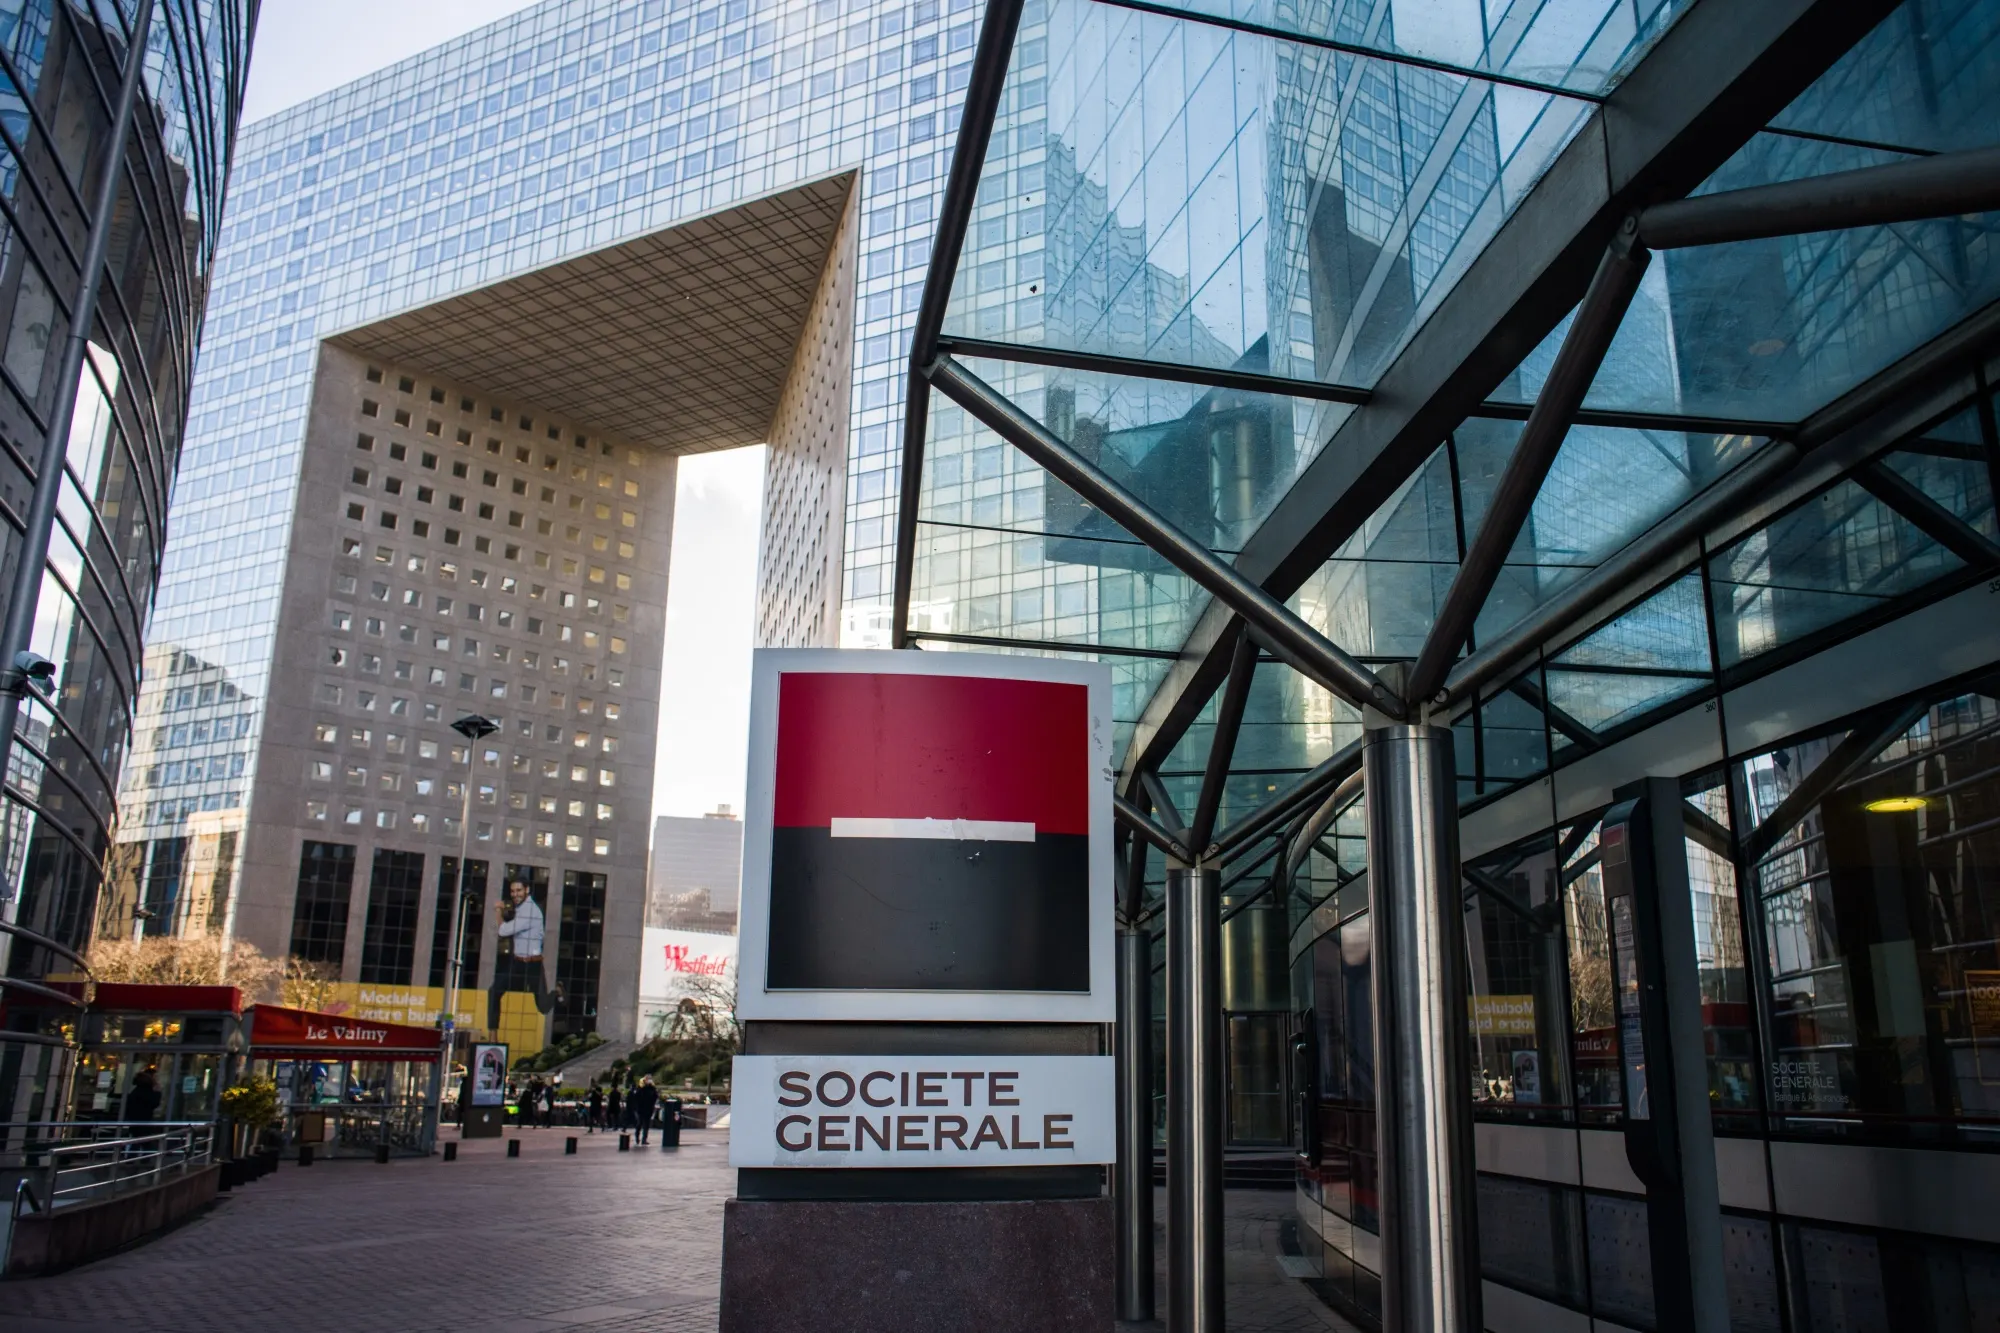
Among European banks reporting on 29 October, Societe Generale lifted third-quarter group net income 24.1% to €1.89 billion, which the French bank called a record, as revenue outpaced almost flat costs.
ING, the Amsterdam-listed bank, reported third-quarter net result up 3.5% the same day. For Societe Generale shareholders, nine-month return on tangible equity reached 12.3%, above the bank’s 2026 target. In The Edge’s reading, French retail is the core of the improvement: the French Retail, Private Banking and Insurance division supplied 66% of the quarter’s €367 million rise in group net income, while cutting its own costs.
Nine-month group net income rose 17.3% to €5.37 billion, also a record in the bank’s words. Both periods grew, with the third quarter running ahead of the nine-month pace.
Revenue growth outpaces costs by 7 percentage points
Net banking income, the bank’s term for revenue, rose 7.8% in the quarter. At constant perimeter and exchange rates, which strips out a €48 million negative impact from disposals, the rise was 8.4%.
Operating expenses rose only 0.8%, and with revenue growing far faster, the cost-to-income ratio improved to 57.1%. Costs in Global Banking and Investor Solutions rose €123 million on higher variable pay, the bank said, largely offset by lower transformation charges, disposals and other cost reductions.
Cost of risk was 28 basis points of loans, inside the bank’s guidance range of 25 to 30 basis points for the year. A smaller share of profit went to minority holders, down 18.6%, so group net income grew faster than net income before minorities, which rose 17.2%.
Third-quarter group results (in € millions)
| Line | Q3 2026 | Q3 2025 | Change |
|---|---|---|---|
| Revenues | 7,173 | 6,655 | +7.8% |
| Operating expenses | 4,093 | 4,060 | +0.8% |
| Cost of risk | 408 | 369 | +10.7% |
| Operating income | 2,673 | 2,226 | +20.1% |
| Group net income | 1,888 | 1,521 | +24.1% |
Revenues are net banking income. Changes as printed by the bank, at current perimeter and exchange rates.
Nine-month group results (in € millions)
| Line | 9M 2026 | 9M 2025 | Change |
|---|---|---|---|
| Revenues | 21,375 | 20,529 | +4.1% |
| Operating expenses | 12,577 | 12,994 | -3.2% |
| Cost of risk | 1,153 | 1,068 | +8.0% |
| Operating income | 7,644 | 6,467 | +18.2% |
| Group net income | 5,374 | 4,582 | +17.3% |
Nine months to 30 September. Changes as printed by the bank, at current perimeter and exchange rates.
French retail and equities drive the quarter
The French Retail, Private Banking and Insurance division raised third-quarter group net income 55.4%, the largest gain of the three businesses. Its costs fell 5.1%. Its cost-to-income ratio dropped to 56.1% from 65.7%.
Online bank BoursoBank, with more than 9.4 million clients, contributed €101 million of net income. Net interest income in the division rose 12.7%, the largest source of its revenue growth.
Global Banking and Investor Solutions lifted net income 22.4% and remains the largest of the three businesses by net income. Equities revenues rose 45.9% to €1.20 billion, a level the bank described as a record for the quarter.
Fixed income and currencies went the other way, with revenues down 20.6% on lower activity in rates, the bank said. The Mobility, International Retail Banking and Financial Services division reported net income down 11.1%, and leasing arm Ayvens saw revenues fall 12.2%, which the bank put down to lower results from used car sales, partly offset by higher margins.
The Mobility division’s cost of risk rose to 47 basis points from 43 in the second quarter. The release does not explain that rise.
Group net income by business, Q3 2026 (in € millions)
| Business | Q3 2026 | Change |
|---|---|---|
| French Retail, Private Banking and Insurance | 682 | +55.4% |
| Global Banking and Investor Solutions | 899 | +22.4% |
| Mobility, International Retail Banking and Financial Services | 349 | -11.1% |
| Corporate Centre | -42 | Narrower |
| Group | 1,888 | +24.1% |
Changes against the third quarter of 2025 as printed by the bank; the Corporate Centre loss narrowed from €45 million.
Capital stays above requirements and the share count shrinks
The common equity tier 1 ratio was 13.4% at 30 September. The bank put its margin over the regulatory requirement at an estimated 320 basis points, or an estimated 300 basis points pro forma against the requirements the European Central Bank has notified for 1 January 2027. The ratio already deducts a distribution accrual of €3.42 per share, which includes the €0.75 interim dividend paid in October.
The €1.5 billion extraordinary share buyback was completed on 30 September. The share count used for net asset value per share was 5.1% lower than at the end of 2025. Tangible net asset value per share rose 7.0% over the nine months to €76.40.
Total assets reached €1.69 trillion at 30 September, up 9.3% since December. Risk-weighted assets, the base for the capital ratios, grew more slowly, by 3.1%.
Customer deposits on the funded balance sheet grew 6.9% from the end of 2025, faster than the 3.2% rise in customer loans. The gross non-performing loan ratio edged up to 2.75% at 30 September from 2.70% at the end of June, and the release gives no reason for the rise.
Balance sheet (in € millions)
| Line | 30 Sep 2026 | 31 Dec 2025 |
|---|---|---|
| Total assets | 1,690,707 | 1,546,641 |
| Customer loans | 467,324 | 454,504 |
| Customer deposits | 554,523 | 525,810 |
| Shareholders’ equity | 73,361 | 70,144 |
Consolidated balance sheet; shareholders’ equity is the group share. Loans are at amortised cost. The loan and deposit growth rates in the text use the bank’s funded balance sheet, which is on a different basis.
Also reporting on 29 October: ING
ING Groep’s third-quarter net result rose 3.5%, slower than the 8.9% gain over the nine months. Total income grew 5.6% in the quarter, and fee income rose 9.3%.
Other income was lower, reflecting effects from heightened interest rate volatility that the bank expects to reverse over time. ING said risk costs were affected by a management overlay; excluding one-offs they were well below its through-the-cycle average of 20 basis points of average customer lending.
Strong capital generation and a CET1 ratio of 13.3% allowed it to announce a further €1.9 billion distribution, the bank said. Total assets were €1.18 trillion at 30 September, 12.0% more than at the end of 2025.
ING results by period (in € millions)
| Line | 2026 | 2025 | Change |
|---|---|---|---|
| Total income, Q3 | 6,227 | 5,898 | +5.6% |
| Net result, Q3 | 1,850 | 1,787 | +3.5% |
| Total income, 9M | 18,334 | 17,237 | +6.4% |
| Net result, 9M | 5,353 | 4,917 | +8.9% |
Third quarter and nine months to 30 September; changes as printed in the release. Each bank reports on its own definitions: ING’s profit line is net result and its revenue line is total income, against group net income and net banking income at Societe Generale. Total assets were 1,181,407 at 30 September 2026 against 1,054,405 at 31 December 2025.
What to watch: Societe Generale reports fourth-quarter and full-year 2026 results on 4 February 2027 and first-quarter 2027 results on 4 May 2027, with its combined general meeting on 13 May 2027. ING plans to give an update on its strategy at its Capital Markets Day on 14 June 2027.
Figures are from Societe Generale’s results press release and ING’s third-quarter press release, both dated 29 October 2026; percentages and comparisons not attributed to a source are The Edge’s calculations.
Sources: Societe Generale, ING, The Edge.