Gas Climbs 31.6 Percent in 3 Months While Brent Falls 14.4 Percent in Euros, INSEE Data Show
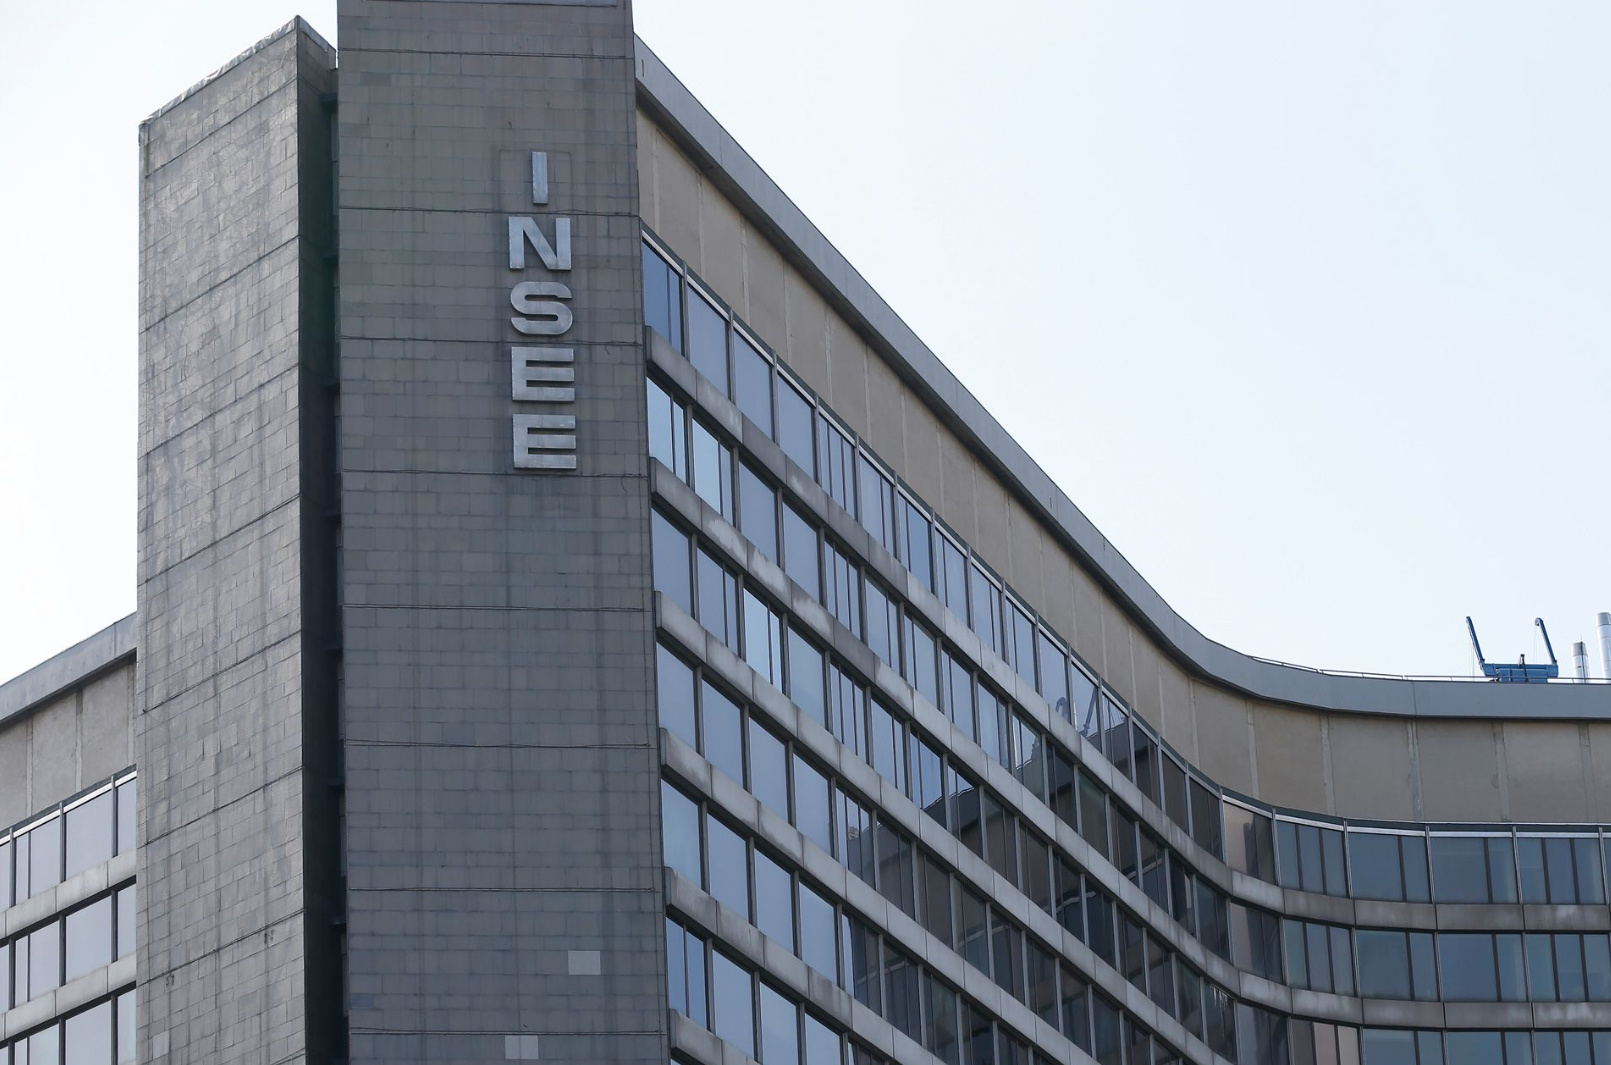
The European benchmark gas price rose another 15.1 percent in August to an average of 62.1 euros per megawatt hour, after a 20.1 percent jump in July, and stood 90.0 percent higher than a year earlier, France’s statistics office INSEE reported on 25 September. Oil went the other way over 3 months. Brent averaged 75.9 euros a barrel, up 3.3 percent on the month but 14.4 percent lower than 3 months earlier. On our calculation, the 2 monthly gas increases compound to about 38 percent over July and August. The 3-month figure of 31.6 percent is measured against the May average, so it also takes in June.
Gas and oil part company
Brent rose 4.9 percent in dollars to average 88.0 dollars a barrel, but only 3.3 percent in euros, because the dollar weakened over the month. On our calculation, the 2 averages imply a rate of about 1.16 dollars per euro. Over 12 months, the barrel rose 29.6 percent in dollars and 30.0 percent in euros, so the currency made almost no difference over the year. TTF gas is priced in euros, so no currency effect applies, and its 3-month rise of 31.6 percent came while the barrel was falling.
| Energy | August level | Month | Year |
|---|---|---|---|
| Brent, $ per barrel | 88.0 | +4.9% | +29.6% |
| Brent, € per barrel | 75.9 | +3.3% | +30.0% |
| Gas TTF, € per MWh | 62.1 | +15.1% | +90.0% |
| Uranium, € per pound | 75.9 | +1.2% | +21.1% |
Monthly averages. Over 3 months, Brent fell 15.1 percent in dollars and 14.4 percent in euros, gas rose 31.6 percent and uranium rose 3.6 percent.
Precious and non-ferrous metals up by more than a third in a year
Prices in euros of imported raw materials excluding energy rose 1.2 percent in August and 9.9 percent over the year, and the all commodities index stood at 168.7 on a 2010 base. Industrial raw materials rose 1.8 percent after a 3.1 percent fall in July and were 22.4 percent higher than a year earlier, with precious metals up 38.7 percent and non-ferrous metals up 33.5 percent. Ferrous metals were the exception, 0.8 percent lower. Among the strategic materials the statistics office tracks for French industry, every price was higher than a year earlier, several of them sharply.
| Material | August price | Year |
|---|---|---|
| Lithium, € per tonne | 128,197.0 | +82.8% |
| Silver, € cents per ounce | 5,627.1 | +72.3% |
| Cobalt, € per tonne | 48,244.0 | +70.2% |
| Molybdenum, € per tonne | 61,645.8 | +50.1% |
| Copper, € per tonne | 12,380.4 | +49.3% |
The 5 largest annual rises among the 9 strategic materials in the release. Chromium rose 3.0 percent, nickel 12.8 percent, palladium 19.6 percent and platinum 33.7 percent.
Food rose 0.7 percent on the month, after 4.9 percent in July, and 0.6 percent on the year. Within it, cereals were 26.9 percent higher than a year earlier and tropical foodstuffs 13.9 percent lower.
Why it matters: The non-energy index is weighted by each material’s share of France’s raw material imports, so its 9.9 percent annual rise is measured on the mix of inputs France buys abroad. Over 3 months the cost pressure has moved from oil to gas, although over the year the barrel is still 30.0 percent dearer in euros.
Outlook: The September figures are due on 27 October. The next reading will show whether the gas rise eases after 2 double-digit monthly increases, and whether Brent’s 3-month decline in euros continues.
Sources: INSEE.