Spain’s Industrial Output Rises 2.0% in September as Energy Production Climbs 6.6%

Spain’s industrial production rose 2.0% in September from a year earlier after calendar and seasonal adjustment, with energy growing fastest, the National Statistics Institute (INE) said on 6 November.
For Spanish industry the month made up for August rather than changing pace. Output rose 0.8% on the month after a 0.7% fall, and the annual rate has stayed positive every month since March. In The Edge’s reading, energy and capital goods are carrying Spanish industry while consumer goods shrink, so growth now rests on power and equipment output rather than on goods made for households.
The index measures the volume of output in mining, manufacturing, energy supply and water collection, on a 2021 base, from a sample of 11,500 industrial establishments. Without adjustment for the calendar and the season, production rose 2.5% on the year.
Energy and capital goods lift the annual rate
Energy output rose 6.6% on the year, the highest annual rate among the institute’s groupings, up from 4.8% in August. Capital goods, the machinery and equipment that companies invest in, accelerated to 2.8% from 0.2%.
Intermediate goods, the materials and parts that factories sell to one another, grew 1.8%, close to August’s 1.7%. On the month they rose 1.6%, and energy rose 1.5%.
Consumer goods went the other way. Their output fell 1.6% on the year, a deeper decline than August’s 0.8%. Non-durable goods slipped 1.2%.
Durable consumer goods fell 5.2%, the weakest annual rate in the table. Even so, the decline has narrowed from 7.5% in August and 9.2% in July. Durable output also rose 2.0% on the month, the best monthly rate among the groupings the institute ranked.
The September figures came with revisions. August’s adjusted annual growth now stands at 1.3%, down from the 1.5% first published in October. The unadjusted August rate moved to 1.3% from 1.6%. The monthly fall of 0.7% was unchanged.
Output by main industrial grouping (in %)
| Grouping | Sep y/y | Aug y/y | Sep m/m |
|---|---|---|---|
| Total industry | 2.0 | 1.3 | 0.8 |
| Consumer goods | -1.6 | -0.8 | -0.2 |
| Durable | -5.2 | -7.5 | 2.0 |
| Non-durable | -1.2 | -0.4 | 0.3 |
| Capital goods | 2.8 | 0.2 | 0.9 |
| Intermediate | 1.8 | 1.7 | 1.6 |
| Energy | 6.6 | 4.8 | 1.5 |
Calendar and seasonally adjusted series. Annual changes are against the same month of 2025, monthly changes against August 2026; August figures as revised on 6 November 2026.
Spain’s third quarter edges up while Germany and France slip
Averaging the three months, adjusted output in the third quarter was 0.2% higher than in the second quarter, on The Edge’s calculation from the monthly index levels. It was 1.9% above the third quarter of 2025.
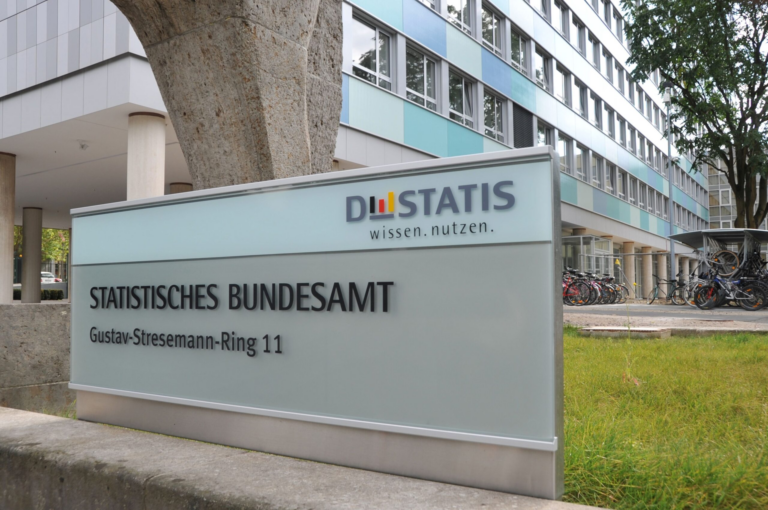
The euro area’s two largest economies went the other way. Germany’s Federal Statistical Office (Destatis) reported that third quarter production was 0.4% below the second quarter, despite a 0.7% rise in September from August.
In France, the National Institute of Statistics and Economic Studies (INSEE) said output in the whole of industry fell 0.5% in September from August. Its third quarter output was 1.1% below the second quarter and 0.6% below the same quarter of 2025. The three national series differ in coverage and method (Germany’s headline index includes construction, which Spain’s excludes), so the comparison is one of direction rather than exact size.
Adjusted output in the first nine months was 1.5% above the same period last year, faster than the 1.1% growth recorded a year earlier.
The adjusted index reached 104.68 points in September, 0.01% below May. May’s 104.69 was the highest level since January 2019.
Measured against the base year, capital goods output was 14.3% higher and energy 9.5% higher. Intermediate goods were still 3.2% below it, and durable consumer goods 2.1% below.
Comunidad de Madrid leads the regions as five post declines
Regional results are published only on the unadjusted series. Comunidad de Madrid posted the largest annual rise, 8.6%, ahead of Región de Murcia at 5.6%. Andalucía followed with 5.3%.
Five regions recorded declines. Comunidad Foral de Navarra fell 5.5% after a 12.8% rise in August, the largest swing between the two months in the table. Extremadura fell 4.0%, and Cantabria 3.6%.
Cataluña’s output was unchanged on the year, after a 4.9% fall in August. Comunitat Valenciana, Illes Balears and Aragón all returned to growth after declines in August.
Over the first nine months, Castilla y León leads with growth of 6.1%, ahead of Región de Murcia at 5.8%. Extremadura has the deepest nine month decline, 5.5%, followed by Asturias at 4.0%.
Industrial production by region (in %)
| Region | Sep | Aug | Jan-Sep |
|---|---|---|---|
| Spain | 2.5 | 1.3 | 1.5 |
| Madrid | 8.6 | 2.1 | 4.6 |
| Murcia | 5.6 | 10.3 | 5.8 |
| Andalucía | 5.3 | 7.1 | 5.0 |
| Valenciana | 4.8 | -1.1 | -0.1 |
| País Vasco | 4.7 | 0.3 | 1.0 |
| Balears | 4.2 | -2.0 | -2.2 |
| Castilla y León | 4.1 | 4.8 | 6.1 |
| Galicia | 1.4 | 3.0 | 0.6 |
| Asturias | 0.8 | 1.3 | -4.0 |
| Aragón | 0.5 | -1.3 | -0.3 |
| Castilla-La Mancha | 0.3 | 7.8 | 1.5 |
| Cataluña | 0.0 | -4.9 | 0.3 |
| Canarias | -2.8 | -2.1 | 0.2 |
| La Rioja | -3.1 | 5.7 | -0.8 |
| Cantabria | -3.6 | -6.1 | -0.8 |
| Extremadura | -4.0 | -5.4 | -5.5 |
| Navarra | -5.5 | 12.8 | -2.2 |
Unadjusted series. Sep and Aug are annual changes against the same month of 2025, with August as revised on 6 November 2026; Jan-Sep compares the average of the first nine months with the same period of 2025.
What to watch:
Eurostat publishes euro area industrial production for September on 16 November.
INE releases Spain’s October index on 4 December.
Method: Spanish figures are from the National Statistics Institute’s Industrial Production Index press release for September 2026 (provisional) and its INEbase tables, both of 6 November 2026, compared with its August 2026 release of 6 October 2026; German and French figures are from Destatis press release No. 389 of 6 November 2026 and INSEE Informations rapides No. 269 of 5 November 2026; quarterly averages, percentages and comparisons not attributed to a source are The Edge’s calculations.
Sources: National Statistics Institute (INE), Destatis, INSEE, Eurostat, The Edge.