EU Bank Assets Rise 5.18% to €34.99 Trillion While Return on Equity Improves to 5.31%
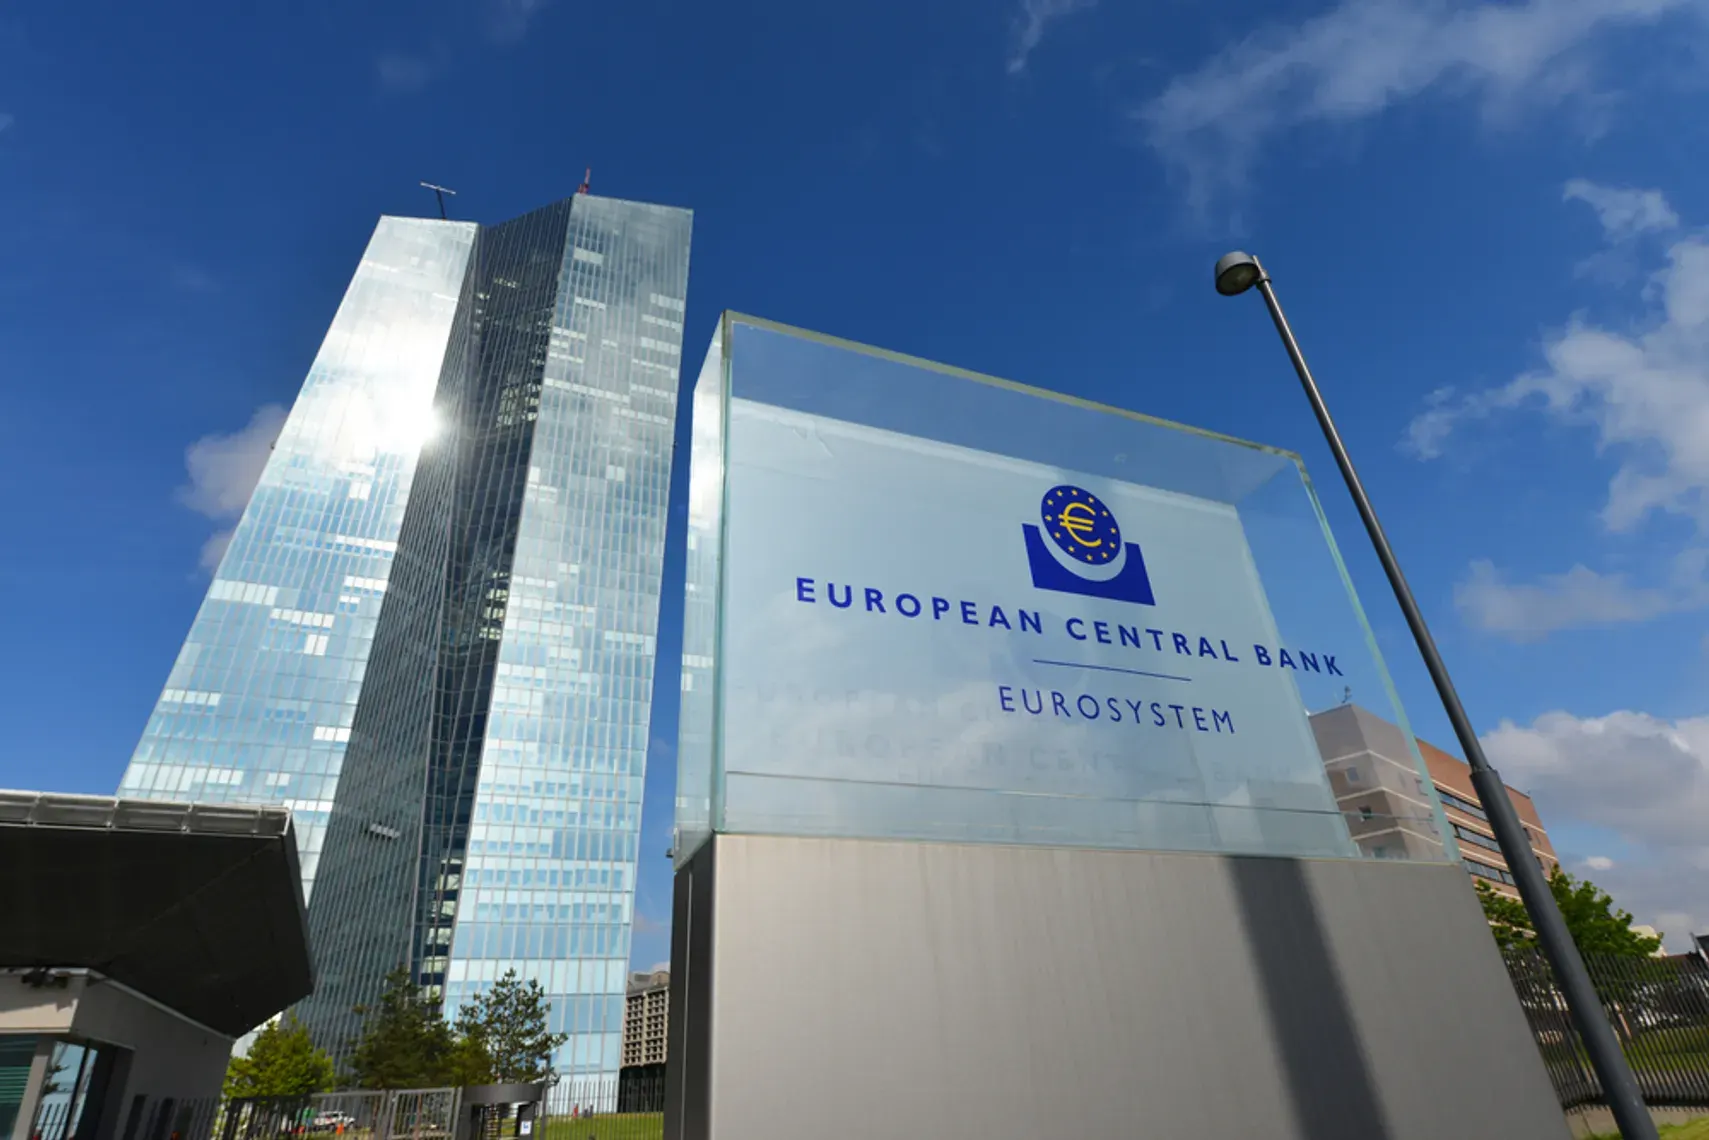
Total assets of EU-headquartered banks rose 5.18% in the year to end-June to €34.99 trillion, the European Central Bank’s consolidated banking data show, while first-half profitability improved.
For investors in European banks, the system is growing its balance sheet almost three times as fast as a year earlier and earning a little more on its equity. Capital ratios barely moved, and the share of loans that have gone bad edged up to 1.99%, the one headline measure moving the wrong way. In The Edge’s reading, first-half profitability improved, although the unannualised measure cannot by itself establish whether full-year returns will exceed 2025.
Balance sheets grow at almost three times last year’s pace
Assets increased by €1.72 trillion over the twelve months. In the year to June 2025 they had grown 1.74%.
Most of the gain came in 2026. Assets rose 4.48% from end-December, including 1.92% in the second quarter alone.
On the euro area’s 21 members, Bulgaria counted in both years, banks grew assets 5.43% to €32.00 trillion. That is 91.45% of the EU total. Banks in the six EU countries outside the euro grew 2.62% to €2.99 trillion.
France has the largest banking system on this measure, at €9.91 trillion after growth of 6.61%. Its banks alone supplied 35.6% of the EU increase.
Spanish banks grew fastest of the five largest systems, by 8.01%, and added €328 billion, the second largest increase after France. German banks, the second largest group, added only 1.47%.
The five largest systems hold 79.33% of EU bank assets. They also delivered 79.6% of the year’s increase, so growth was not concentrated in the smaller markets.
Total assets by banking system
| System | June 2025, €bn | June 2026, €bn | Change |
|---|---|---|---|
| EU | 33,270 | 34,994 | 5.18% |
| Euro area | 30,354 | 32,002 | 5.43% |
| EU outside the euro area | 2,916 | 2,992 | 2.62% |
| France | 9,298 | 9,912 | 6.61% |
| Germany | 7,599 | 7,711 | 1.47% |
| Spain | 4,092 | 4,420 | 8.01% |
| Italy | 2,810 | 2,968 | 5.60% |
| Netherlands | 2,591 | 2,751 | 6.18% |
Domestic banking groups and stand-alone banks, consolidated, by country of headquarters; June 2026 figures are provisional; the euro area is a fixed composition of its 21 members of June 2026, summed from the country series, Bulgaria included in both years; EU outside the euro area is the EU total less the euro area; changes are computed on unrounded figures.
Returns improve, and Spanish banks earn double the German rate
Return on equity was 5.31% for the first six months of 2026, up from 5.06% a year earlier. The ratio is not annualised: it sets six months of profit against total equity.
On the ECB’s euro area series, which adds Bulgaria from 2026, banks improved more, to 5.21% from 4.90%. Return on assets for the EU rose to 0.39% from 0.37%.
Costs absorbed less of income. The cost-to-income ratio fell 1.05 percentage points to 52.42%.
Doubling a first-half return is no guide to the full year. Doubling the first half of 2025 would have given 10.12%, more than the 9.29% the year delivered.
The country spread is wide. Czech banks earned the most, at 8.51% for the half, and Slovak banks the least, at 3.38%.
Among the large systems, Spanish banks returned 8.08%, more than twice the 3.82% of German banks. French banks earned 3.81%. Italian banks slipped to 7.34% from 8.05%.
EU banking system indicators (in %)
| Measure | June 2025 | June 2026 |
|---|---|---|
| Return on equity, first half | 5.06 | 5.31 |
| Return on assets, first half | 0.37 | 0.39 |
| Cost-to-income ratio | 53.46 | 52.42 |
| CET1 ratio | 16.42 | 16.43 |
| Tier 1 ratio | 17.63 | 17.70 |
| Solvency ratio | 19.84 | 19.89 |
| Non-performing loans ratio | 1.96 | 1.99 |
| Coverage ratio | 42.19 | 41.53 |
| Net stable funding ratio | 128.02 | 126.75 |
| Loan-to-deposit ratio | 94.89 | 95.08 |
EU-headquartered domestic banking groups and stand-alone banks; profitability for the first six months of each year, not annualised; June 2025 figures as published with the June 2026 data, which include a few revisions to past data; June 2026 figures are provisional.
Capital ratios barely move while bad loans edge higher
The Common Equity Tier 1 ratio, core capital against risk-weighted exposures, was 16.43% at end-June. A year earlier it was 16.42%.
On the same basis, euro area banks lifted the ratio to 16.25% from 16.17%. The Tier 1 ratio for the EU rose to 17.70%, and the total solvency ratio to 19.89%.
Bulgarian banks report the highest core capital ratio, at 36.38%. Spanish banks have the lowest at 14.09%, though up from 13.70%. Italian banks fell to 15.63% from 16.18%.
Non-performing loans rose to 1.99% of total loans, from 1.96%. The ratio counts cash at central banks and other demand deposits as loans.
The two largest systems moved up. Germany’s ratio climbed 0.14 percentage points to 1.80%. France’s rose 0.12 points to 2.24%.
Italy and Spain moved the other way. Italy’s ratio fell to 2.45% from 2.62%. Spain’s eased to 2.40% from 2.52%.
The highest ratios are in Bulgaria, at 4.13%, and Poland, at 4.12%. Lithuania has the lowest, at 0.66%.
The coverage ratio slipped to 41.53% from 42.19%.
Funding ratios moved little. The net stable funding ratio eased to 126.75% from 128.02%. Loans equal 95.08% of deposits, against 94.89% a year earlier.
Five largest banking systems, end-June 2026 (in %)
| System | Return on equity | CET1 ratio | NPL ratio |
|---|---|---|---|
| France | 3.81 | 15.96 | 2.24 |
| Germany | 3.82 | 16.69 | 1.80 |
| Spain | 8.08 | 14.09 | 2.40 |
| Italy | 7.34 | 15.63 | 2.45 |
| Netherlands | 5.49 | 17.18 | 1.31 |
| Euro area | 5.21 | 16.25 | 2.02 |
| EU | 5.31 | 16.43 | 1.99 |
Ranked by total assets; return on equity for the first six months, not annualised; the NPL ratio includes cash balances at central banks and other demand deposits in total loans; provisional data; euro area figures are the ECB’s own euro area series, which follows the changing composition and so covers the same 21 members as the asset table in June 2026.
The dataset covers 336 banking groups and 2,283 stand-alone credit institutions and non-EU controlled subsidiaries and branches operating in the EU, nearly all of the EU banking sector’s balance sheet. Reporters generally apply international accounting standards, though some small and medium-sized ones may use national rules. The figures also include a few revisions to past data.
Our 28 and 29 October roundups set out third-quarter results from BNP Paribas, Société Générale and ING, three months beyond these June figures.
What to watch: The ECB’s statistical calendar tentatively sets the end-September 2026 consolidated banking data for 12 February 2027 at 09:00 GMT. The year-end dataset, with its fuller set of indicators, is tentatively set for 11 June 2027 at 08:00 GMT.
Method: Figures are from the European Central Bank’s press release “ECB publishes consolidated banking data for end-June 2026” of 6 November 2026 (09:00 GMT) and the consolidated banking data (CBD2) series on its Data Portal published the same day; percentages, shares, differences and comparisons not attributed to a source are The Edge’s calculations.
Sources: European Central Bank, The Edge.