Commodities Wrap 30 July: Palladium Jumps 4.7 Percent as Metals Rally and Oil Slips
The metals complex led commodities higher on Thursday while crude oil slipped, as a sharply weaker US dollar lifted precious and industrial metals even as energy prices eased. Front-month Brent crude traded at 89.31 dollars a barrel, down 1.58 percent, and West Texas Intermediate at 83.80 dollars, off 0.78 percent, per CNBC, giving back part of the security premium built up earlier in the week.
Energy was mixed but softer at the top of the barrel. Brent and WTI both retreated, and refined products fell harder, with heating oil down 3.35 percent and RBOB gasoline off 2.71 percent, per CNBC, as the risk premium around the Middle East conflict eased alongside the dollar. Natural gas bucked the trend, rising 1.54 percent to 2.764 dollars per million British thermal units after the US Energy Information Administration reported a storage build of 28 billion cubic feet for the week ended 24 July, smaller than the market had expected, which lifted inventories to 3,084 billion cubic feet. The pullback in crude followed a run of gains and leaves oil holding well above its levels of a week ago, our reading.
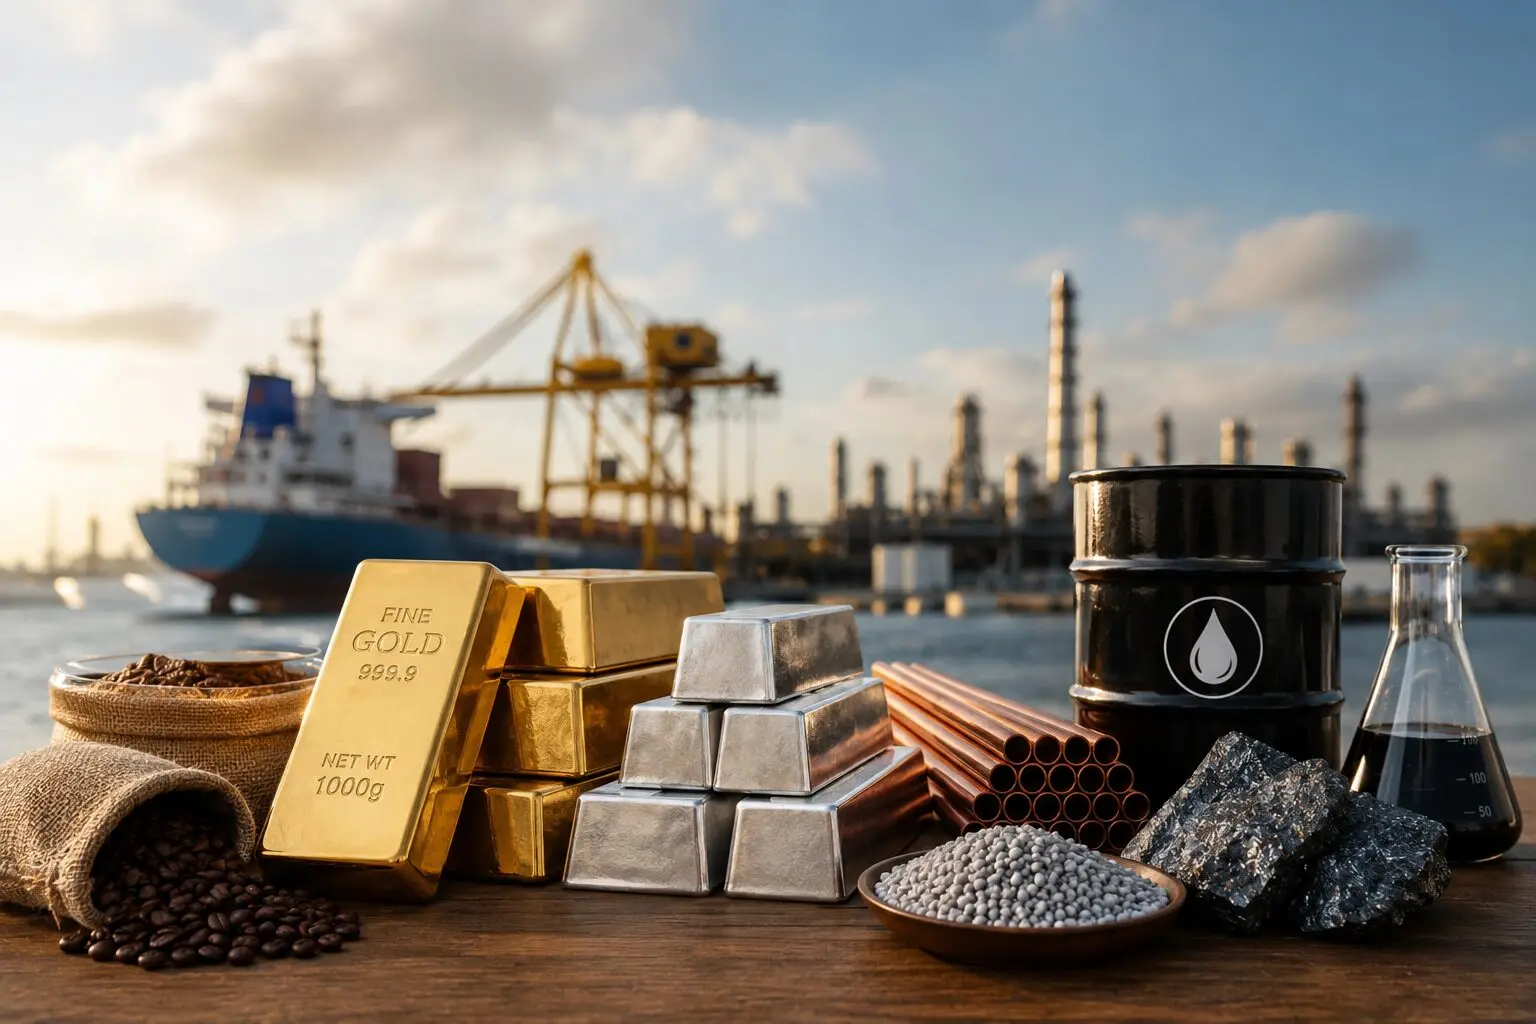
Precious and base metals rallied across the board. Palladium led the complex, jumping 4.70 percent to 1,311.00 dollars an ounce, with platinum up 3.95 percent to 1,665.60 dollars and copper adding 2.55 percent to 6.4725 dollars a pound. Silver rose 1.66 percent to 59.055 dollars an ounce and gold gained 1.65 percent to 4,102.80 dollars, leaving the gold to silver ratio near 69.5, our calculation. The weaker dollar provided the broad tailwind, while the scale of the gains in palladium, platinum and copper pointed to firm demand for metals with both industrial and investment exposure, our reading.
Agriculture was mixed. Cotton led the gainers, up 1.50 percent, with wheat 0.42 percent higher and coffee 0.19 percent firmer, while cocoa fell 1.29 percent, corn 0.69 percent, sugar 0.41 percent and soybeans 0.36 percent, per CNBC. The moves were modest against the sharper swings in metals and energy.
In the wider markets, the US dollar fell and equity volatility collapsed. The dollar index dropped 0.99 percent to 99.891, the euro rose 0.58 percent to 1.1532 and the yen strengthened 2.68 percent to 159.00 per dollar, per CNBC. The volatility index tumbled 13.65 percent to 17.84 in a sign of stronger equity risk appetite, while Treasury yields rose, the 10-year up about 4.3 basis points to 4.665 percent, and Bitcoin gained 1.48 percent to about 64,722 dollars.
Why it matters: The read for the Gulf runs through both the oil and the dollar, our reading. Softer crude trims the export revenue of producers such as Saudi Arabia, Kuwait, the UAE and Qatar at the margin, but the easing of the security premium also lowers the freight and insurance costs that had been building around regional shipping, a net relief for exporters. The metals rally lifts the mark-to-market value of the region’s official gold reserves, and because the Gulf currencies are anchored to the dollar, a weaker dollar mainly eases the cost of imports priced in euros and yen rather than dollar-priced goods. For Egypt and Jordan the lower oil bill offers modest support, though for Egypt the pound eased to about 51.0 per dollar, which offsets part of that benefit for dollar-priced imports.
Outlook: The immediate drivers are the course of the Middle East conflict and the path of the dollar, our reading. A firmer dollar or renewed escalation could quickly rebuild the oil premium that came out of prices, while the metals rally will test whether safe-haven and industrial demand holds if the dollar steadies. The next US natural gas storage report, due on 6 August, and the run of macro data into the Federal Reserve’s next meeting are the near-term catalysts to watch.
Table – Energy, 30 July, ranked by change:
| Instrument | Level | Change |
|---|---|---|
| Natural gas | $2.764 | +1.54% |
| WTI crude | $83.80 | -0.78% |
| Brent crude | $89.31 | -1.58% |
| RBOB gasoline | $3.3057 | -2.71% |
| Heating oil | $4.2238 | -3.35% |
Table – Metals, 30 July, ranked by change:
| Instrument | Level | Change |
|---|---|---|
| Palladium | $1,311.00 | +4.70% |
| Platinum | $1,665.60 | +3.95% |
| Copper | $6.4725 | +2.55% |
| Silver | $59.055 | +1.66% |
| Gold | $4,102.80 | +1.65% |
Table – Agriculture, 30 July, ranked by change:
| Instrument | Level | Change |
|---|---|---|
| Cotton | 80.72 | +1.50% |
| Wheat | 663.50 | +0.42% |
| Coffee | 309.15 | +0.19% |
| Soybeans | 1,188.50 | -0.36% |
| Sugar | 14.44 | -0.41% |
| Corn | 468.50 | -0.69% |
| Cocoa | $5,118.00 | -1.29% |
Table – Rates, currencies, volatility and crypto, intraday 30 July, ranked by percent change:
| Instrument | Level | Change |
|---|---|---|
| Bitcoin | $64,722.17 | +1.48% |
| US 30-year Treasury yield | 5.210% | +6.7 bp |
| US 10-year Treasury yield | 4.665% | +4.3 bp |
| USD/EGP | 51.02 | +0.79% |
| GBP/USD | 1.3471 | +0.76% |
| EUR/USD | 1.1532 | +0.58% |
| US 2-year Treasury yield | 4.229% | -0.7 bp |
| USD/KWD | 0.3077 | -0.05% |
| US Dollar Index | 99.891 | -0.99% |
| USD/JPY | 159.00 | -2.68% |
| VIX | 17.84 | -13.65% |
Sources: CNBC; US Energy Information Administration.