Egypt’s Exports to Malaysia Climb 13.3 Percent as the Trade Gap Narrows 9.3 Percent
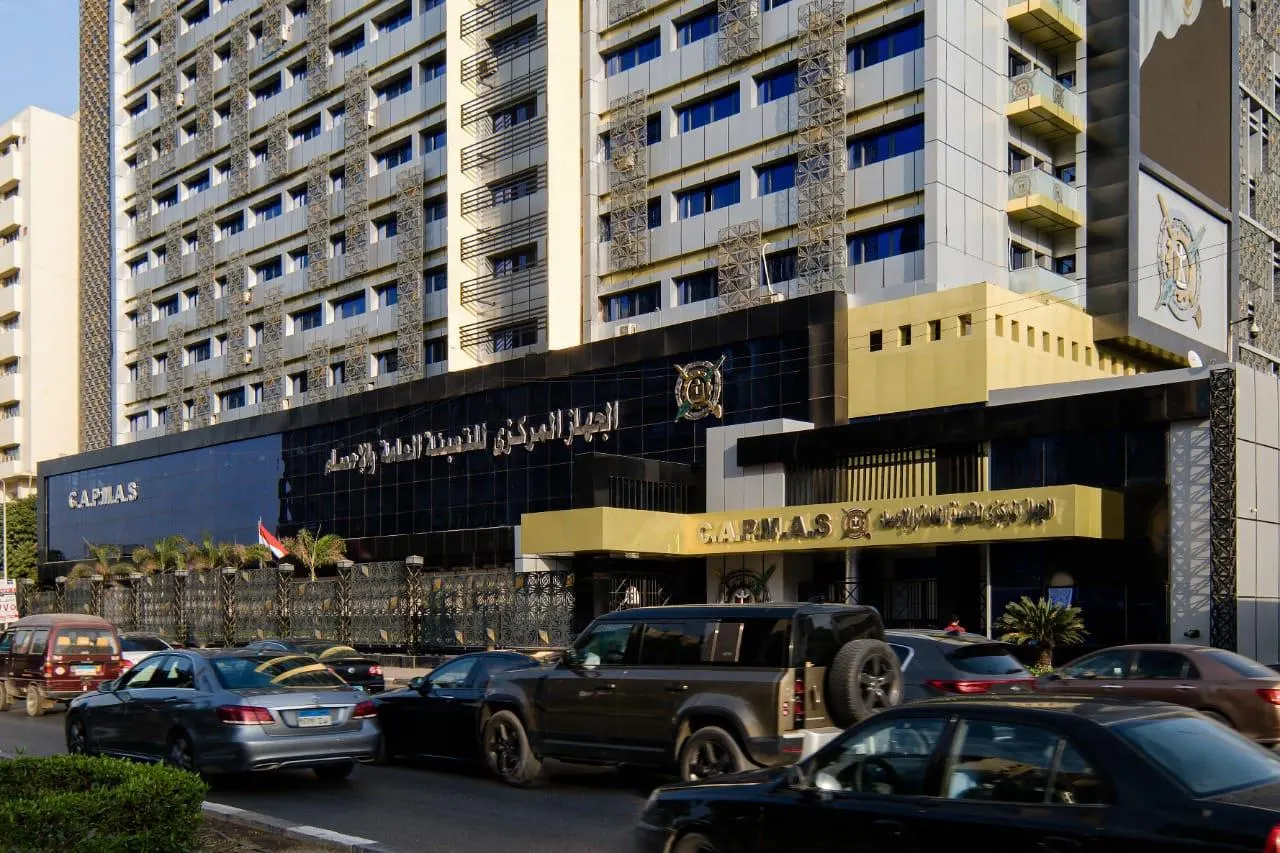
Egypt’s exports to Malaysia rose 13.3 percent to 68 million dollars in the first 8 months of 2026, up from 60 million dollars in the same period of 2025, according to figures published on 9 October by Egypt’s Central Agency for Public Mobilization and Statistics (CAPMAS). With imports from Malaysia lower, Egypt’s bilateral trade deficit narrowed to 359 million dollars from 396 million, an improvement of 37 million dollars, or 9.3 percent, on our calculation. The release came as President Abdel Fattah El-Sisi left Seoul for Kuala Lumpur at the start of a state visit to Malaysia, the second stop on his Asian tour, according to the State Information Service.
Exports Gain Ground While the Gap Narrows
The improvement in the balance has two sources, and they are not equal. Lower imports, down 29 million dollars, account for 78.4 percent of the 37 million dollar narrowing; higher exports, up 8 million dollars, account for the other 21.6 percent, on our calculation. Exports are still small against imports, but they are the only goods-trade line in the release that grew.
Exports covered 15.9 percent of imports from Malaysia in January to August 2026, against 13.2 percent a year earlier, on our calculation. Exports also make up a larger share of bilateral trade: 13.7 percent of the 495 million dollar total, up from 11.6 percent of 516 million dollars. Monthly shipments averaged 8.5 million dollars in 2026, against 7.5 million in 2025.
Total trade was 4.1 percent lower than a year earlier, and imports fell 6.4 percent to 427 million dollars from 456 million. The agency put the lower total down to the fall in imports.
Egypt’s Exports to Malaysia Gain Ground, January to August
| Measure | 8M 2026 | 8M 2025 | Change |
|---|---|---|---|
| Egyptian exports | $68m | $60m | +13.3% |
| Imports from Malaysia | $427m | $456m | -6.4% |
| Total trade | $495m | $516m | -4.1% |
| Trade balance | -$359m | -$396m | +$37m |
Values and percentage changes as published on 9 October 2026; the trade balance and its change are our calculation from the published exports and imports.
Fruit, Vegetables, Stone and Cement Lead the Export Basket
Egypt’s sales to Malaysia rest on two product groups: vegetables and fruit, and the salt, sulphur, stone and cement group. Together they make up 60.3 percent of the total on our calculation. The top five groups account for 49 million dollars, or 72.1 percent of exports.
Egypt’s Leading Export Groups to Malaysia, January to August 2026
| Product group | Value | Share of exports |
|---|---|---|
| Vegetables and fruit | $23m | 33.8% |
| Salt, sulphur, stone, cement | $18m | 26.5% |
| Carpets and floor coverings | $3m | 4.4% |
| Aluminium and its products | $3m | 4.4% |
| Ready-made garments | $2m | 2.9% |
Values as published; shares are our calculation against total exports of 68 million dollars.
The import side is much more concentrated. Vegetable and animal fats and oils were worth 227 million dollars, or 53.2 percent of everything Egypt bought from Malaysia, on our calculation. That is an average of 28.4 million dollars a month. Electrical machinery and parts (40 million dollars), cocoa and its preparations (34 million), rubber and its products (32 million) and organic chemicals (22 million) follow. The top five import groups total 355 million dollars, or 83.1 percent of imports.
Malaysia Against Korea, the Tour’s First Stop
The statistics agency published a matching note on Egypt’s trade with Korea on 7 October, covering the same 8 months, so the two partners can be compared directly. Egypt’s exports to Korea rose to 58 million dollars from 53 million, a gain of 9.4 percent on our calculation, so the 13.3 percent rise in exports to Malaysia is the faster of the two. Malaysia is the smaller trading partner overall, at 56.6 percent of Korea’s 874 million dollars, but it buys 1.17 times as much from Egypt.
Egypt’s Trade With Korea and Malaysia, January to August 2026
| Measure | Malaysia | Korea |
|---|---|---|
| Egyptian exports | $68m | $58m |
| Export growth | +13.3% | +9.4% |
| Imports | $427m | $816m |
| Total trade | $495m | $874m |
| Exports to imports | 15.9% | 7.1% |
| Trade balance | -$359m | -$758m |
Exports and imports as published in the 9 October (Malaysia) and 7 October (Korea) releases; growth for Korea, coverage ratios and balances are our calculation.
Exports to Malaysia cover 15.9 percent of imports from Malaysia, more than double the 7.1 percent coverage with Korea, and Egypt’s gap with Malaysia is 47.4 percent of its gap with Korea, on our calculation. Both gaps narrowed from a year earlier: the gap with Korea came in at 758 million dollars, against 814 million. Across Korea and Malaysia combined, Egyptian exports reached 126 million dollars in the 8 months, up 11.5 percent from 113 million.
Remittances, Investment and the National Export Picture
Remittances run in Egypt’s favour. Egyptians working in Malaysia sent home 9.5 million dollars in fiscal year 2024/25, up from 7.9 million the year before, a rise CAPMAS put at 21.2 percent. Malaysians working in Egypt sent 1.7 million dollars home, leaving Egypt a net remittance inflow of 7.8 million dollars, on our calculation. The release put the Egyptian community in Malaysia at 5,500 people at the end of 2025, citing the mission’s estimates.
On investment, Egyptian investment in Malaysia reached 199.9 million dollars in fiscal 2024/25, 30.3 times the 6.6 million dollars of Malaysian investment in Egypt, on our calculation. Egypt’s population of 109.6 million is 3 times Malaysia’s 36.5 million.
The bilateral figures run alongside a strong national export reading. The latest national monthly bulletin, for June 2026, showed Egypt’s total exports up 37.4 percent to 5.0 billion dollars from 3.6 billion. Petroleum products rose 128.0 percent, ready-made garments 47.7 percent and fresh fruit 77.1 percent. Fruit and garments are both on Egypt’s list of leading exports to Malaysia. Imports rose 49.4 percent to 12.4 billion dollars in the same month, with crude oil up 141.0 percent, which put the national deficit for June at 7.5 billion dollars against 4.7 billion a year earlier.
Why it matters: Egypt’s exports to Malaysia are growing from a small base, faster than its exports to Korea, and the bilateral deficit is closing from both directions. Vegetables and fruit, together with salt, sulphur, stone and cement, already make up 60.3 percent of the basket, which gives Egypt a base to build on in a market of 36.5 million people. On the import side, fats and oils account for 53.2 percent of Egypt’s purchases, so the value of that one group does most to set the balance. Net remittance inflows of 7.8 million dollars and 199.9 million dollars of Egyptian investment in Malaysia in fiscal 2024/25 give the relationship a financial dimension beyond goods trade.
Outlook: The state visit to Kuala Lumpur puts the relationship on the agenda at the highest level. Any agreements will be judged against the 68 million dollars of exports and the 15.9 percent coverage ratio set in the first 8 months. The full-year 2026 figures will show whether exports keep their 8.5 million dollar monthly pace through December. The next national monthly bulletin, for July, will show whether national export growth is holding up.
Sources: CAPMAS, State Information Service, The Edge.