Egypt’s BRICS Deficit Widens 63.9 Percent as the UAE Reports 312 Billion Non Oil Trade
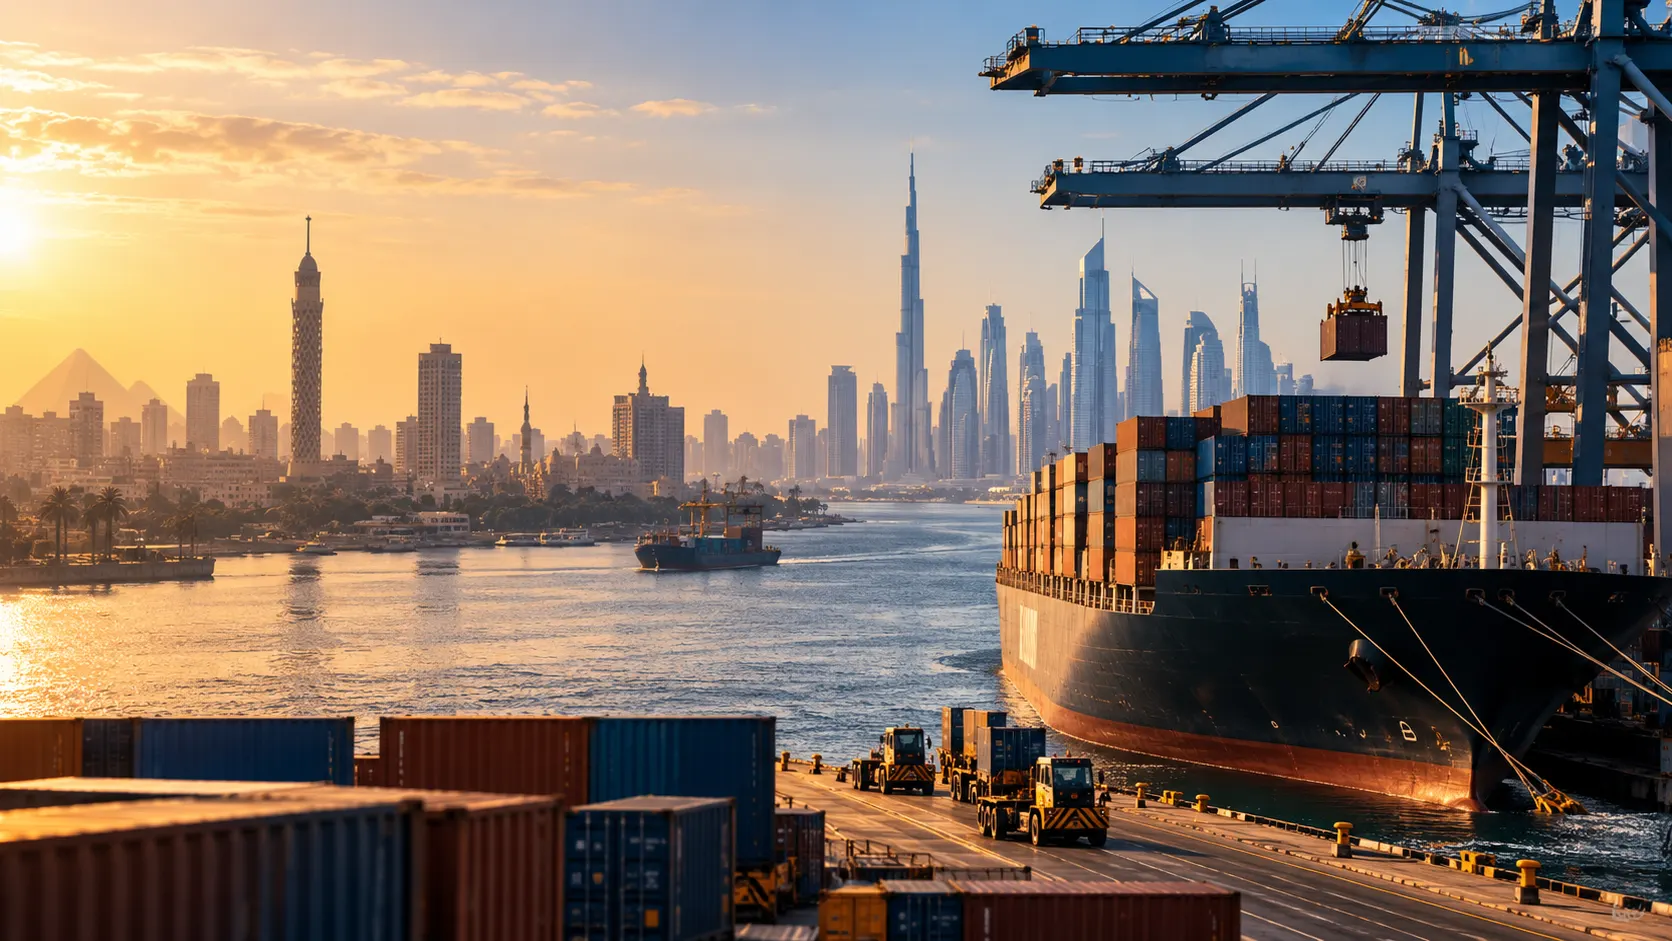
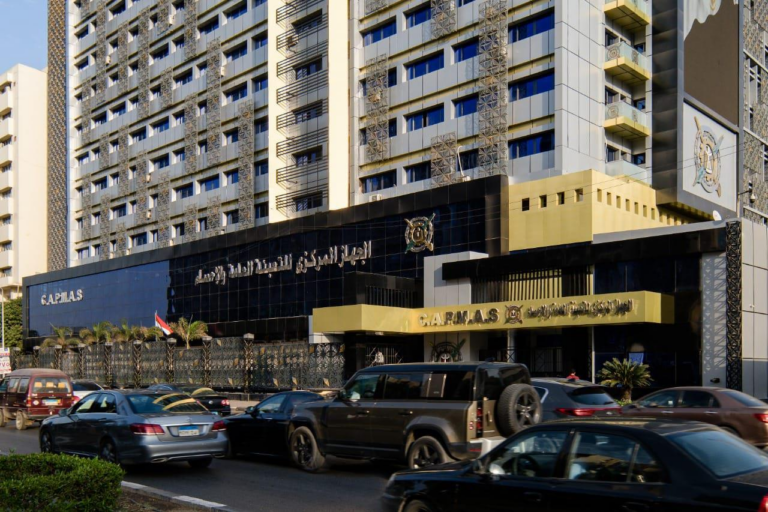
Egypt bought 30.2 billion dollars of goods from BRICS countries in the first half of 2026 and sold them 6.6 billion dollars, leaving a trade deficit with the bloc of 23.6 billion dollars for the six months, on our calculation. The Central Agency for Public Mobilization and Statistics published the figures on Saturday. Imports rose 38.5 percent against the same half of 2025 while exports fell 10.8 percent, on our calculation, so the gap widened by 9.2 billion dollars in a single year, an increase of 63.9 percent.
The United Arab Emirates had published a very different kind of number the day before, ahead of the summit. Non oil trade between the UAE and BRICS countries exceeded 312 billion dollars in 2025 against 243 billion in 2024, growth of 28.5 percent, and the bloc accounted for around 31 percent of the country’s total non oil foreign trade. Its Minister of Foreign Trade, Dr Thani bin Ahmed Al Zeyoudi, repeated the headline figure in New Delhi on Sunday.
The cover ratio fell 12.1 points in a year
The sharpest way to read the Egyptian release is what exports now pay for, and every figure in this paragraph is our calculation from the published values. In the first half of 2025, exports to the bloc covered 33.9 percent of what Egypt imported from it. In the first half of 2026 they covered 21.9 percent, a fall of 12.1 percentage points in twelve months. Put the other way, every dollar Egypt earned selling into BRICS in the latest half was matched by 4.58 dollars spent buying from it, against 2.95 dollars a year earlier.
| Measure | H1 2025 | H1 2026 | Change |
|---|---|---|---|
| Total trade | $29.3bn | $36.7bn | +25.3% |
| Egyptian imports | $21.8bn | $30.2bn | +38.5% |
| Egyptian exports | $7.4bn | $6.6bn | -10.8% |
| Trade deficit | $14.4bn | $23.6bn | +63.9% |
| Export cover of imports | 33.9% | 21.9% | -12.1 pts |
Trade values as published for the first half of each year. The release carries no percentage changes of its own, so the deficit, the cover ratio and every rate shown are our calculation. The cover ratio change is computed from the ratios before rounding, so it differs from the difference between the two rounded figures in the row. Exports and imports as published do not sum exactly to the published total, which is carried here as issued.
China accounts for 40.5 percent of the gap
Nine BRICS members are named in the Egyptian release, eight of them with values published in both directions. Egypt runs a clear goods surplus with South Africa, at 44 million dollars on our calculation, and it is the smallest trading partner on the list but one. It may run a second with Ethiopia, at 34 million dollars, though the release names Ethiopia and Indonesia together in the export list and attaches a single value to Ethiopia. Every other member sells Egypt more than it buys.
China is the single largest source of the imbalance, and the ratios here are ours. It supplied 10.4 billion dollars of goods in the six months against 841 million dollars of Egyptian exports going the other way, a bilateral gap of 9.56 billion dollars that is 40.5 percent of the entire BRICS deficit. China sold Egypt 12.4 dollars of goods for every dollar it bought. Of the eight members with values published in both directions, Russia is the most lopsided after it, at 7.9 to one.
| Country | Egyptian exports to | Egyptian imports from | Balance |
|---|---|---|---|
| China | $841mn | $10.4bn | -$9.56bn |
| UAE | $1.7bn | $5.3bn | -$3.60bn |
| Saudi Arabia | $1.8bn | $5.2bn | -$3.40bn |
| Russia | $480mn | $3.8bn | -$3.32bn |
| Brazil | $633mn | $2.4bn | -$1.77bn |
| India | $868mn | $1.7bn | -$832mn |
| South Africa | $111mn | $67mn | +$44mn |
| Ethiopia | $47mn | $13mn | +$34mn* |
First half of 2026, ranked by imports. Balances are our calculation. The country values are published to one decimal in billions, so the balances carry that rounding. Indonesia is named as an import source at 1.2 billion dollars and its export value is not published separately, so it is not carried here. The asterisk marks the Ethiopian balance: the release names Ethiopia and Indonesia together in the export list and attaches the single value of 47 million dollars to Ethiopia.
The commodity detail shows the same pattern inside single categories, on our calculation throughout. Egypt sold the bloc 844 million dollars of fuel, mineral oils and distillation products and bought 5.2 billion dollars of the same category, 6.2 times as much. In electrical machinery and apparatus it sold 400 million dollars and bought 4.6 billion dollars, 11.5 times as much. Its strongest export line was pearls, precious stones and jewellery at 1.2 billion dollars, followed by vegetables and fruit at 1 billion dollars. The six named export groups account for 65.2 percent of everything Egypt sold the bloc; the six named import groups cover 51.8 percent of what it bought.
The two published figures count entirely different things
The Egyptian and Emirati numbers cannot be added together or ranked against each other, and the reason is worth stating. Egypt published total goods trade for six months of 2026. The UAE published non oil trade for the calendar year 2025. Egypt published the direction of the flow and therefore a deficit; the UAE published a volume with no balance attached, so whether it sells the bloc more than it buys is not in the statement. The UAE published BRICS as a share of its own non oil trade, at around 31 percent, and broke that share down by direction; the Egyptian release gives no equivalent share.
| Measure | Egypt | UAE |
|---|---|---|
| Published trade with BRICS | $36.7bn | $312bn |
| Period covered | first half of 2026 | calendar 2025 |
| Scope | all goods | non oil only |
| Growth on the year before | +25.3% | +28.5% |
| Share of the country’s own trade | not published | about 31% |
As published by each originator. The Egyptian growth rate is our calculation from the two published half year totals; the Emirati rate and share are as published, against a 2024 base of 243 billion dollars. The two periods do not overlap. Saudi Arabia published no comparable BRICS figures in the same period.
Both readings show growth, but not of the same thing over the same time. Egyptian trade with the bloc grew 25.3 percent in the first half of 2026 against the first half of 2025, on our calculation. Emirati non oil trade grew 28.5 percent across calendar 2025 against 2024, as stated by the minister. The two periods do not overlap by a single month, and one figure excludes oil while the other includes everything, so no multiple between them is worth printing.
Where the two do meet is on direction, and the Emirati release is explicit about it. BRICS supplied 34 percent of the UAE’s imports but took only 23 percent of its non oil exports, with re-exports at 28 percent. That is an eleven point gap between what the bloc sells the UAE and what it buys from it, on our reading of the published shares. Egypt’s version of the same asymmetry is far wider, but it is the same asymmetry.
Remittances are Egypt’s counterweight, and they are concentrated
Set against the Egyptian goods deficit is a labour income flow measured over a different period, and every derived figure in this paragraph is our calculation. Egyptians working in BRICS countries sent home 15.7 billion dollars in the 2024/2025 financial year against 9.8 billion dollars the year before, a rise of 60.2 percent. Saudi Arabia alone accounted for 12 billion dollars of that, and the United Arab Emirates for a further 3.6 billion dollars. The two Gulf members supplied 99.4 percent of the total between them, with 0.3 percent from the other seven.
| Source of remittances | FY2024/2025 | Share of total |
|---|---|---|
| Saudi Arabia | $12,000mn | 76.4% |
| UAE | $3,600mn | 22.9% |
| Other seven members | $54.3mn | 0.3% |
| All BRICS states | $15,700mn | 100% (stated) |
Remittances of Egyptians working in BRICS states, Egyptian financial year ending 30 June 2025, in millions of dollars. Shares and the combined figure for the other seven members are our calculation. The nine published country values sum to 15,654.3 million dollars against a stated total of 15,700 million.
The flow in the opposite direction is small but growing much faster, and every figure in this paragraph is ours. BRICS nationals working in Egypt remitted 202.5 million dollars in 2024/2025 against 76.2 million dollars a year earlier, an increase of 165.7 percent. Inward remittances were 77.5 times outward ones in the latest year, down from 128.6 times the year before, so the ratio is narrowing from an extreme base.
Investment is the smallest of the three flows the Egyptian release covers, and it is measured over the same financial year as remittances. Every derived figure in this paragraph is our calculation. BRICS countries invested 6.2 billion dollars in Egypt during 2024/2025 and Egypt invested 2.2 billion dollars in them, a net inflow of 4 billion dollars. The United Arab Emirates supplied 4.7 billion dollars of the inward total, or 75.8 percent, and Saudi Arabia 1.1 billion dollars, so two members accounted for 93.5 percent of it. Measured over the same financial year, remittances from the bloc were 2.5 times its direct investment in Egypt.
The contrast between China’s two roles is the sharpest in the release. It is the bloc’s largest supplier of goods to Egypt, at 10.4 billion dollars in six months, and its third largest investor, at 277.6 million dollars across a full financial year, on our reading of the published country values.
Why it matters: Egypt and the United Arab Emirates joined BRICS together in January 2024, and two years and eight months on their published positions inside it look nothing alike. Egypt’s trade channel has moved against it: imports from the bloc are up 38.5 percent in a year while exports have fallen, and the export cover ratio has dropped 12.1 percentage points. What holds the Egyptian relationship together is not goods but the 15.7 billion dollars its workers send home, of which 76.4 percent comes from one country, set against 5.6 million Egyptians resident in those states to the end of 2025. The Emirati statement describes a different position entirely, a bloc that already takes around 31 percent of its non oil trade, with no balance attached. For Egypt the bloc is a claim on foreign currency; for the UAE, on what has been published, it is a market share.
Outlook: the Egyptian trade figures run only to June and the investment and remittance numbers to the close of the 2024/2025 financial year, so the next readable test is the full year trade release and the 2025/2026 remittance total. The question they answer is whether the export decline is a level shift or a single weak half. The Emirati figure carries no balance and no half year split, so nothing in it can be tested until the next annual statement.
Sources: Central Agency for Public Mobilization and Statistics, Ministry of Foreign Trade of the United Arab Emirates, Emirates News Agency.