Egyptian Pound Holds Above Its April Low as Reserves Rise to 57.35 Billion Dollars
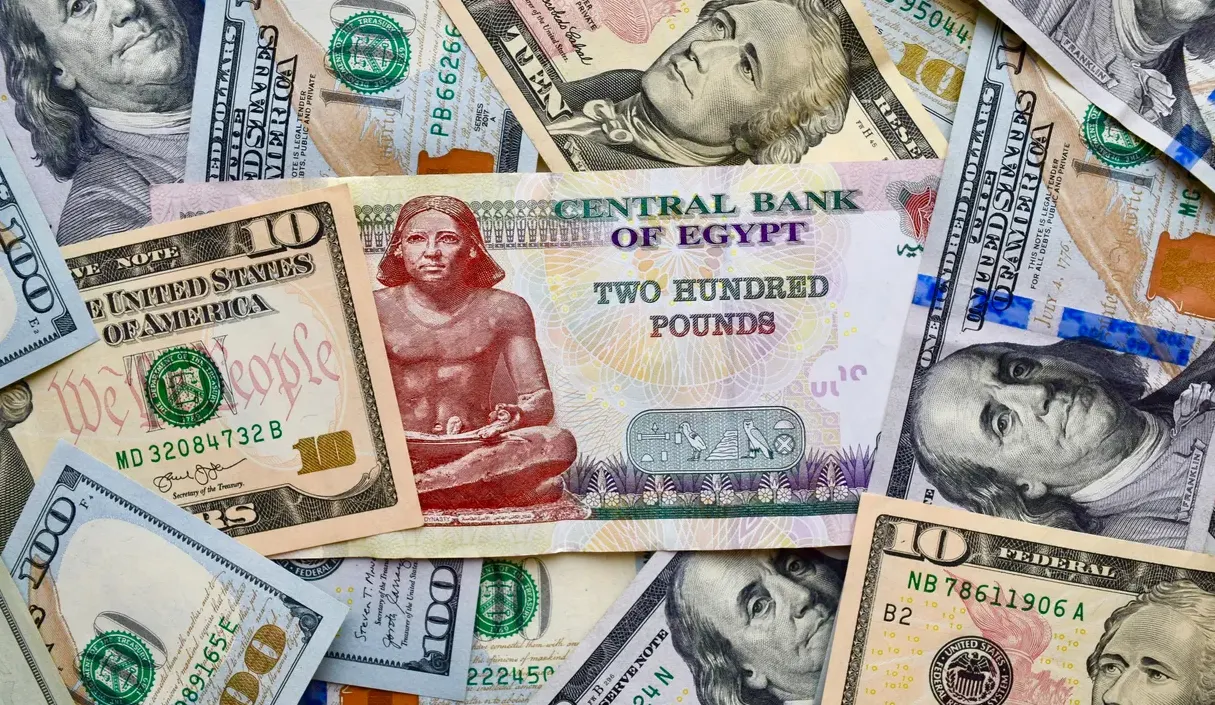
The Egyptian pound stood above its April low on 15 October. On the Central Bank of Egypt’s average market buy rate, the dollar’s price was 53.4134 pounds that day, against its 7 April peak of 54.6537. The dollar had climbed to that peak from 47.8714 on 26 February, the last published date before the conflict began on 28 February, and by 7 July it was back at 48.7606, with 86.89 percent of the move reversed, on our calculation. The rate has since moved back toward its April level, and on 15 October the dollar’s price stood 11.58 percent above the 26 February level, on our calculation. The bank’s Monetary Policy Committee said on 2 April that the exchange rate’s move was serving as “a primary shock absorber”. The IMF wrote on 21 September that the pound “recovered much of its initial losses”, and on 15 October said Egypt’s program had helped in “strengthening the exchange rate’s flexibility”. Behind the currency, net international reserves rose in each of the 7 months since February, to 57,348.2 million dollars at the end of September.
A Flexible Exchange Rate Carried the Pound’s Recovery
The dollar’s gain came as foreign investors left local debt. Non-resident holdings of local-currency government debt went from 39.1 billion dollars in February to 22.2 billion in early April, IMF staff wrote. The adjustment went through the price of the currency. In its 2 April statement the committee described the depreciation in the exchange rate as “a primary shock absorber, effectively mitigating the impact of the energy shock on domestic economic activity and external buffers”, and paused its easing cycle, which had brought a 100 basis point cut on 12 February. Fitch Ratings judged that the central bank did not exert significant influence through exchange controls to reduce outflows, or intervene to limit the depreciation, and added that “the hot money rapidly returned and most of the depreciation was reversed.”
From the dollar’s 7 April peak, the recovery built month by month. The rate stood at 53.5663 at the end of April and 52.2297 on 25 May, the last published date in May. June brought the largest month-end improvement of the recovery, to 49.1763 on 30 June, and the 7 July level was the pound’s strongest since 1 March.
Rising Reserves and Dollar Inflows Back the Pound
Net international reserves rose 4,602.7 million dollars from 52,745.5 million at the end of February to the September level, or 8.73 percent, on our calculation. The September level, published on 7 October, stands 7,814.7 million dollars, or 15.78 percent, above September 2025, on our calculation. June brought both the largest month-end improvement in the rate and the largest reserve gain of the period, 1,938.1 million dollars, and June to September supplied 4,214.0 million, or 91.56 percent of the increase since February, on our calculation. S&P Global Ratings said on 9 October that the return of portfolio inflows allowed foreign currency purchases from the market, lifting international reserve assets, a different measure from net reserves, to what the agency called a record 54.5 billion dollars in September.
Remittances from Egyptians abroad carry the inflow picture to August. In August alone they rose 21.7 percent to 4.2 billion dollars, taking January to August 2026 to what the 13 October release called record inflows of 33.9 billion, up 27.2 percent. On 16 October Moody’s upgraded Egypt’s ratings to B3 from Caa1 and maintained a positive outlook.
Egypt’s Pound and Net Reserves at Each Month-End Since the Conflict Began
| Month-end | USD/EGP, buy | NIR ($ mn) | Monthly change ($ mn) |
|---|---|---|---|
| Feb 2026 | 47.8714 | 52,745.5 | pre-conflict base |
| Mar 2026 | 54.5366 | 52,830.6 | +85.1 |
| Apr 2026 | 53.5663 | 53,009.2 | +178.6 |
| May 2026 | 52.2297 | 53,134.2 | +125.0 |
| Jun 2026 | 49.1763 | 55,072.3 | +1,938.1 |
| Jul 2026 | 51.0934 | 56,293.9 | +1,221.6 |
| Aug 2026 | 50.8678 | 57,214.5 | +920.6 |
| Sep 2026 | 51.9354 | 57,348.2 | +133.7 |
The exchange rate is the average market rate, buy side, in pounds per dollar, on the last published date of each month: 26 February, 25 May and 30 July for the months whose final days carried no rate. Net international reserves for June to September are provisional. Monthly changes are our calculation.
The balance of payments for the fiscal year July 2025 to June 2026, published on 12 October, shows the dollar flows behind the pound, although only March to June came after 28 February. Over that fiscal year remittances rose 29.6 percent to 47.3 billion dollars, tourism revenue 10.3 percent to 18.4 billion and Suez Canal receipts 21.6 percent to 4.4 billion. The current account deficit was 22.5 billion dollars, 7.1 billion wider than a year earlier, and oil imports rose 27.6 percent to 24.9 billion. The capital and financial account brought a net inflow of 23.2 billion dollars against 10.2 billion a year earlier, and foreign direct investment of 18.0 billion made up 77.6 percent of it, on our calculation. The overall balance swung to a 2.8 billion dollar surplus from a 2.1 billion deficit.
Pound Treasury Bills Draw Strong Bids as Price Growth Slows
Demand for pound assets stays firm. At the 15 October Treasury bill auction the 357-day bill drew bids of 187.84 billion pounds against 80 billion offered, 2.35 times, and the 182-day bill 128.70 billion against 45 billion, 2.86 times; the results do not show how much of that demand came from foreign investors. The accepted weighted average yield was 25.705 percent on the 357-day bill and 24.87 percent on the 182-day bill, 6.71 and 5.87 points above the 19.00 percent overnight deposit rate. On the year bill 99.11 billion pounds was accepted, 1.24 times the amount offered, at a nominal yield 11.8 points above September’s 13.9 percent annual urban inflation, on our calculation. That inflation rate looks back over the past 12 months, so the margin is not an assured real return. The committee’s 2 April statement cited an “adequately positive real interest margin”.
Price growth slowed after the first 3 months. Urban headline inflation, published by CAPMAS, peaked at 15.2 percent in March and stood at 13.9 percent in September. Compounding the monthly urban readings, consumer prices rose 7.1 percent from March to September, on our calculation; March to May alone compound to 6.0 percent, and June to September to 1.0 percent over 4 months. Core prices followed the same shape: 6.2 percent across the 7 months, with 4.8 percent in March to May and 1.4 percent from June to September. In September the committee said inflation had turned out more favorable than expected and revised its forecast lower relative to August.
Why it matters: The pound’s path since 28 February shows a flexible exchange rate absorbing a large exit of foreign money from local debt while Egypt’s dollar buffers grew. The currency adjusted, foreign money came back, and the pound, which had reversed most of the dollar’s February to April gain by July, holds above its April low in mid-October. Net reserves ended each of the 7 months since February higher than they began, remittances kept rising through August, and bids at more than twice the amount offered for Treasury bills give the pound a broad base of support as price growth slows.
Outlook: The Monetary Policy Committee meets on 29 October and again on 17 December. It has kept its overnight deposit rate at 19.00 percent at all 5 meetings since the 12 February reduction, and in September projected headline inflation to stabilize on average in the third quarter of 2026 before gradually decelerating and converging on its 7 percent target, plus or minus 2 points, in the second half of 2027. Fitch expects inflation to average 12.3 percent in the fiscal year to June 2027, up from 11.6 percent in the fiscal year to June 2026, with positive real interest rates, a sizable primary surplus and a more flexible exchange rate staying in place.
Sources: Central Bank of Egypt, CAPMAS, IMF, S&P Global Ratings, Fitch Ratings, Moody’s, The Edge.