Gold Suffers Worst Quarter Since 2013 as Hawkish Fed Repricing Hits Bullion
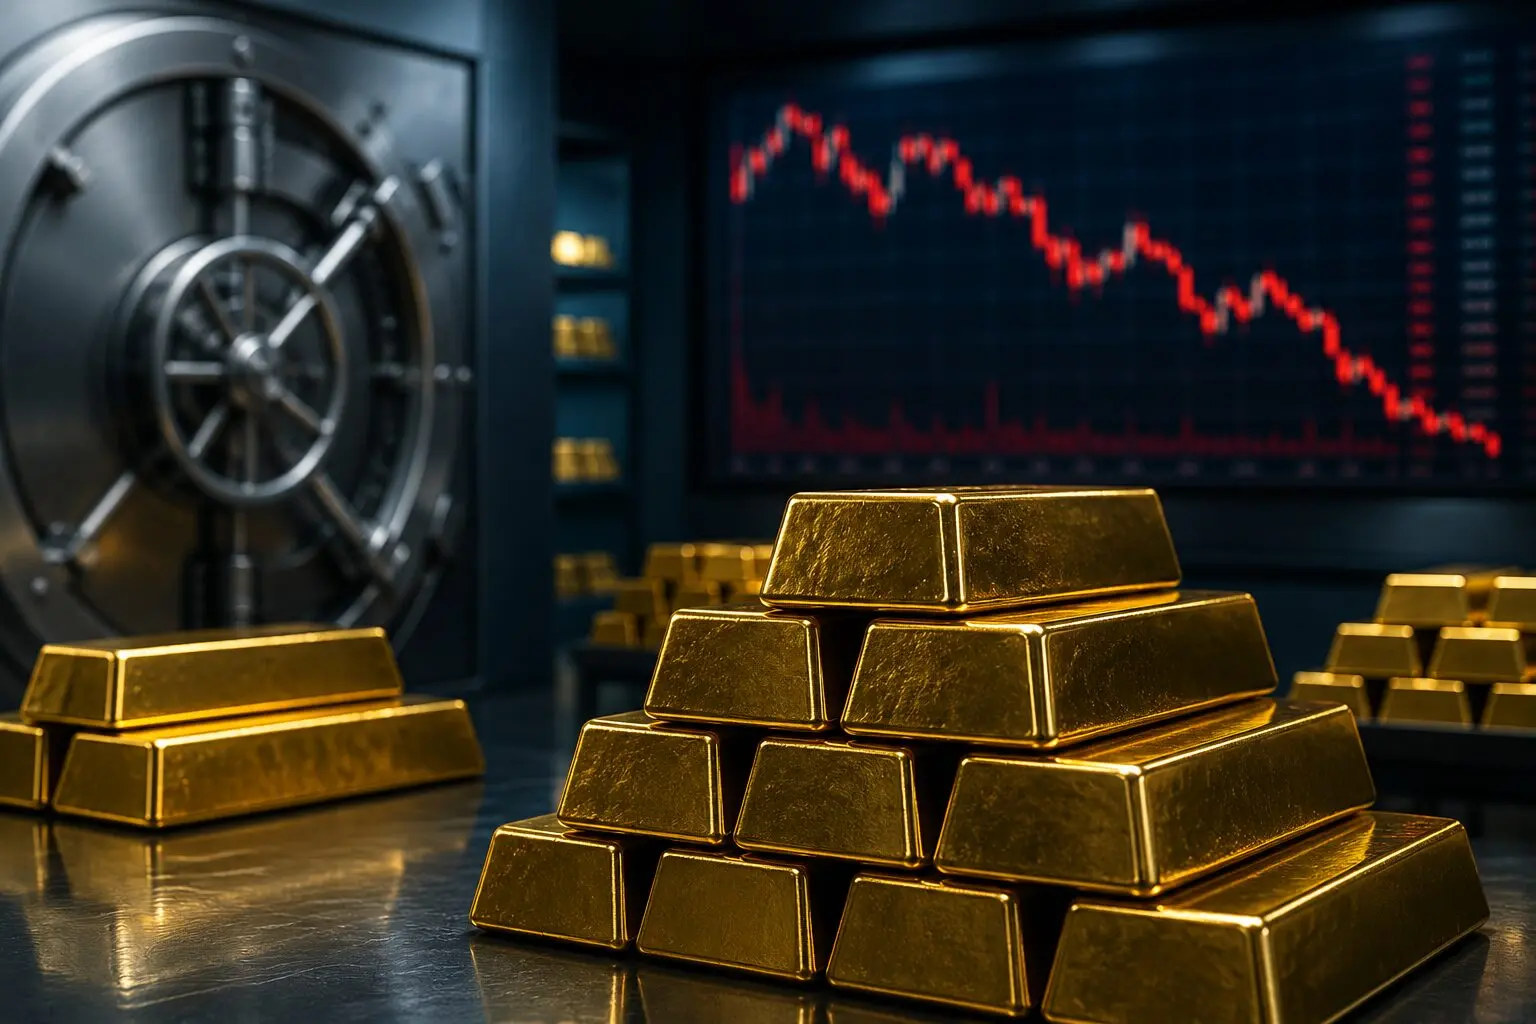
Gold ended the second quarter with its sharpest quarterly loss in 13 years, as a hawkish shift in US rate expectations outweighed safe haven demand and forced a broad repricing across precious metals.
Front month Comex gold futures settled at US$4,022.90 per troy ounce at the end of the quarter, leaving the metal down 13.4 percent in Q2 2026, its worst quarterly performance since the second quarter of 2013. Silver suffered an even sharper correction, falling 20.4 percent to US$59.477 per ounce, its weakest quarter since the first quarter of 2020.
The scale of the move was substantial. Based on the reported 13.4 percent quarterly decline, gold’s implied end March level was around US$4,645 per ounce, meaning bullion lost roughly US$622 per ounce during the quarter. On a standard 100 ounce Comex gold futures contract, that is equivalent to a notional loss of about US$62,000. For silver, the reported 20.4 percent fall implies an end March level near US$74.72 per ounce, or a decline of roughly US$15.24 per ounce, equivalent to about US$76,000 on a standard 5,000 ounce silver futures contract.
The selloff was not mainly a story of collapsing physical demand. It was a financial market repricing. Gold does not generate yield, so its opportunity cost rises when investors expect higher policy rates, higher real yields, or a stronger dollar. That is exactly what changed in June. The Federal Reserve kept the federal funds target range at 3.50 percent to 3.75 percent on June 17, while saying inflation remained elevated relative to its 2 percent goal.
The Fed’s updated projections reinforced the hawkish shift. The median 2026 federal funds rate projection rose to 3.8 percent, from 3.4 percent in March. The median PCE inflation forecast rose to 3.6 percent, from 2.7 percent, while core PCE was lifted to 3.3 percent, also from 2.7 percent. In practical terms, the market moved from viewing inflation as a support for gold to viewing it as a reason for the Fed to stay restrictive.
The dollar added another layer of pressure. The US Dollar Index was near 101.28 early on July 1, after a June 30 previous close of 101.19, and close to its 52 week high of 101.80. A firmer dollar makes dollar priced commodities more expensive for non US buyers and often tightens financial conditions across global markets.
Still, the structural picture is more balanced than the headline quarterly loss suggests. World Gold Council data show that gold backed ETF buying continued in Q1 2026 with inflows of 62 tonnes, although this was far below the very strong 230 tonnes recorded in Q1 2025. Central banks bought 244 tonnes on a net basis in Q1, up 3 percent year on year, even with some selling during the quarter.
Official sector demand also remained visible after the quarter began. Central banks resumed net buying in April, with Poland purchasing 14 tonnes and China adding 8 tonnes, its highest monthly addition since December 2024 and its 18th consecutive month of purchases. This does not prevent sharp corrections, but it suggests that reserve diversification demand remains intact beneath the more volatile financial layer.
For MENA investors, the lesson is broader than gold alone. A stronger dollar and higher US rate expectations influence liquidity, funding costs, deposit pricing, debt servicing, and cross asset allocation across the region. Gold remains a strategic diversification asset for reserve managers, sovereign investors, family offices, and treasury desks, but the second quarter shows that allocation timing matters when Fed repricing is moving quickly.
The key market level now is the US$4,000 per ounce area. A sustained break below that zone would reinforce the view that higher rate expectations and dollar strength are still dominating bullion. A stabilization above it would suggest that the liquidation phase is becoming more selective, particularly if US inflation data soften, Fed hike expectations ease, or the dollar retreats from recent highs.
The next phase for gold will depend less on headline safe haven demand and more on four variables: US inflation, Fed rate pricing, real yields, and ETF flows. Central bank buying provides a longer term support, but Q2 proved that even strong structural demand can be temporarily overwhelmed when the policy rate narrative turns against non yielding assets.
Why it matters: Gold’s worst quarter since 2013 is a warning that the 2026 precious metals rally has become highly sensitive to US monetary policy. For MENA portfolios, the message is not that gold has lost its strategic role. It is that gold’s short term price path is now being driven by the same variables affecting regional funding conditions, dollar liquidity, and asset allocation decisions: the Fed, the dollar, and real yields.
Sources: CNBC; Federal Reserve; World Gold Council; Intercontinental Exchange.