Muscat Stock Exchange Trading Value Jumps 41% to OMR 1.29 Billion in October
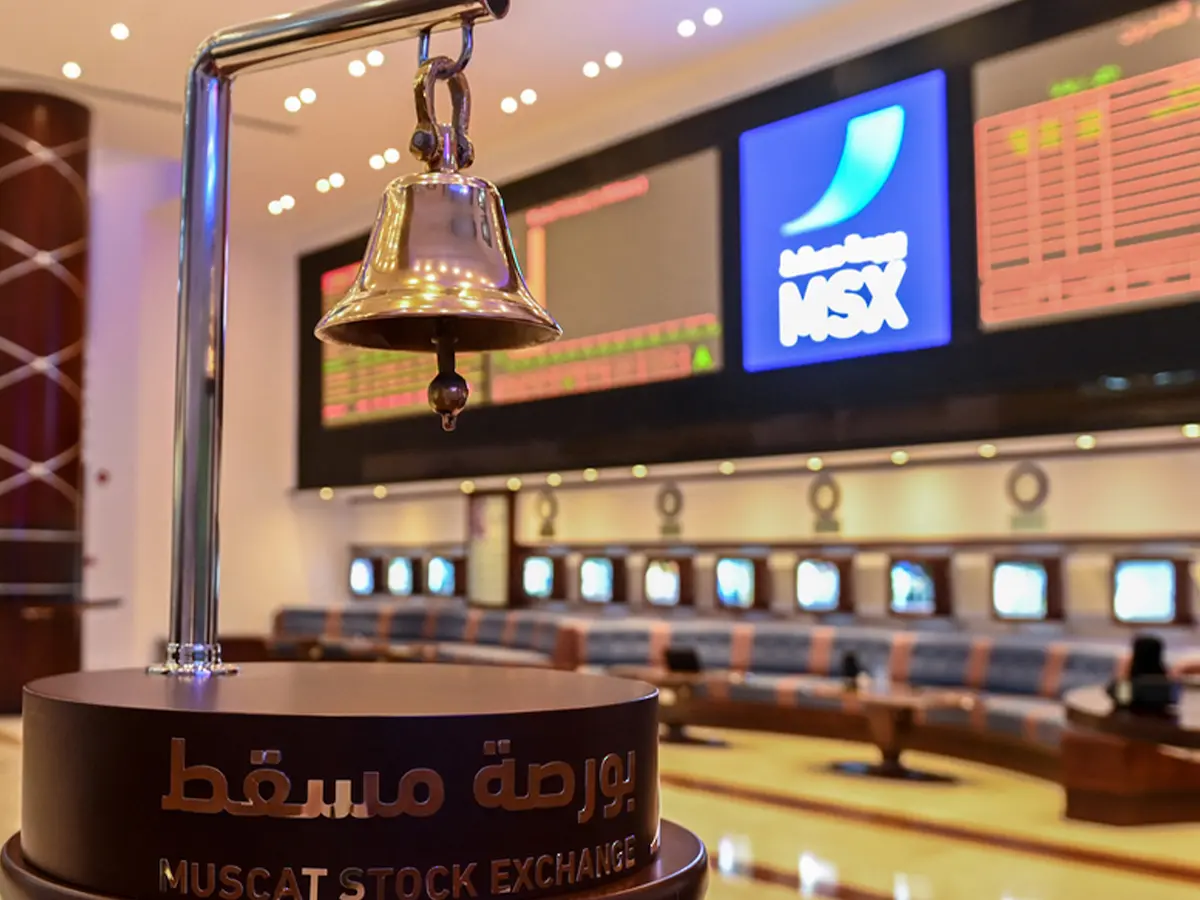
Trading value on the Muscat Stock Exchange rose 41.29% in October to OMR 1,291.4 million, the exchange’s statistics show, the best since April by the Oman News Agency’s account.
For investors in Oman’s market, the month brought deeper liquidity: the average session traded OMR 61.5 million, 48.0% more than in September, by the exchange’s count. In The Edge’s reading, that depth came as the institutional buying and market-making support the agency describes met holders ready to sell after a 28.98% rise in the MSX 30 for the year to September.
The agency credited the rise in trading to market-making funds, the liquidity development fund and buying by local institutional investors. It added that third-quarter results showed improved earnings and higher net profits at listed public joint-stock companies.
It also said the exchange benefited from the positive mood before FTSE Russell announced the addition of the Muscat Stock Exchange to its Watch List for possible reclassification from Frontier to Secondary Emerging, which The Edge set out on 8 October.
Daily turnover runs 48% above September
October’s value topped September’s OMR 914.0 million by OMR 377.4 million. It was also 32% above the OMR 976 million the agency reported for August.
The gain came from busier sessions, not from extra trading days. October had 21 sessions to 29 October, its last trading day, against 22 in September.
Each October session traded OMR 61.5 million on average, against OMR 41.5 million in September.
Trades rose 48.01% to 294,672, the most of any month this year by the agency’s account. September saw 199,083 trades, and the agency put August at 178,000.
The exchange counted 4.19 billion securities traded in October, against 3.38 billion in September. The agency’s count for August was 3.4 billion.
Monthly trading on the Muscat Stock Exchange
| Measure | Aug | Sep | Oct |
|---|---|---|---|
| Value (OMR m) | 976 | 914.0 | 1,291.4 |
| Trades (000s) | 178 | 199.1 | 294.7 |
| Securities (bn) | 3.4 | 3.38 | 4.19 |
September and October from the exchange’s monthly statistics; August as reported by the agency. October had 21 trading sessions and September 22.
Five stocks carry 73% of the month’s value
Sohar International led the exchange’s most traded list with OMR 229.6 million. Omantel came second at OMR 202.2 million. The two alone accounted for 33.4% of the month’s value.
OQ Base Industries, OQ Exploration and Production and Bank Muscat followed, each with more than OMR 160 million traded. Together the five accounted for OMR 946.5 million, or 73.3% of the month’s value.
Two of the five are banks, Sohar International and Bank Muscat, and two carry the OQ name.
Most traded stocks in October (in OMR millions)
| Company | Value |
|---|---|
| Sohar International | 229.6 |
| Omantel | 202.2 |
| OQ Base Industries | 180.7 |
| OQ Exploration and Production | 170.5 |
| Bank Muscat | 163.6 |
Ranked by traded value over the month, from the exchange’s monthly statistics.
National Gas topped the month’s gainers, rising 35.6% to 160 baisa. Sohar Power climbed 34.7% to 256 baisa.
The MSX 30 keeps a 25% gain for 2026
The MSX 30 closed October at 7,346.188, still 25.22% above where it ended 2025. Against the end of October 2025 it stands 30.94% higher.
The index fell 2.92% in October, after easing 0.49% in September. The agency described the month as a correction that weighed on most of the leading stocks.
The month opened with gains. The index rose 3.77% to its October closing high of 7,852.106 on 11 October.
It then eased to a closing low of 7,278.181 on 25 October. The final four sessions left it 0.93% above that low.
MSX 30 at each month-end of 2026
| Month | Close | In 2026 |
|---|---|---|
| Dec 2025 | 5,866.801 | |
| Jan | 6,330.265 | +7.90% |
| Feb | 7,393.369 | +26.02% |
| Mar | 8,168.396 | +39.23% |
| Apr | 8,369.476 | +42.66% |
| May | 7,757.213 | +32.22% |
| Jun | 7,507.935 | +27.97% |
| Jul | 7,277.197 | +24.04% |
| Aug | 7,604.011 | +29.61% |
| Sep | 7,566.818 | +28.98% |
| Oct | 7,346.188 | +25.22% |
Closes on each month’s last trading session; changes are against the end-2025 close.
Every month-end since February has left the index at least 24% above where it started the year. February was the strongest month, with a rise of 16.79%, and March added a further 10.48%.
Total market capitalisation ended October at OMR 38.59 billion, OMR 640.4 million below its September level. Prices rose for 38 securities and fell for 60. Another 14 closed unchanged.
Phoenix Power led the decliners, down 28.6% at 202 baisa. Oman Arab Bank fell 25% to 255 baisa.
Sector index closes, end of October
| Index | Close | Points |
|---|---|---|
| Financial | 13,371 | -235 |
| Industry | 9,713 | -99 |
| Services | 2,950 | -58 |
| Shariah | 609 | -9 |
Closes and October changes in points as reported by the agency, rounded to whole points.
Bond and sukuk trading climbs to OMR 24.5 million
Bonds and sukuk traded OMR 24.5 million in October, the exchange’s statistics show, against OMR 780,000 in September. That is more than 31 times the September value.
Government Development Bond issue 83 led the fixed income market with OMR 12 million traded, the agency said. The sixth sovereign sukuk issue came second at OMR 5 million. Government Development Bond issue 80 ranked third with OMR 2.4 million.
Method: percentage changes, averages, sums, shares and counts not attributed to a source are The Edge’s calculations from the exchange’s monthly statistics and index closes.
Sources: Muscat Stock Exchange, Oman News Agency, The Edge.