Oman’s Trade Surplus Jumped 37 Percent as Non-Oil Exports Grew 1.5 Percent
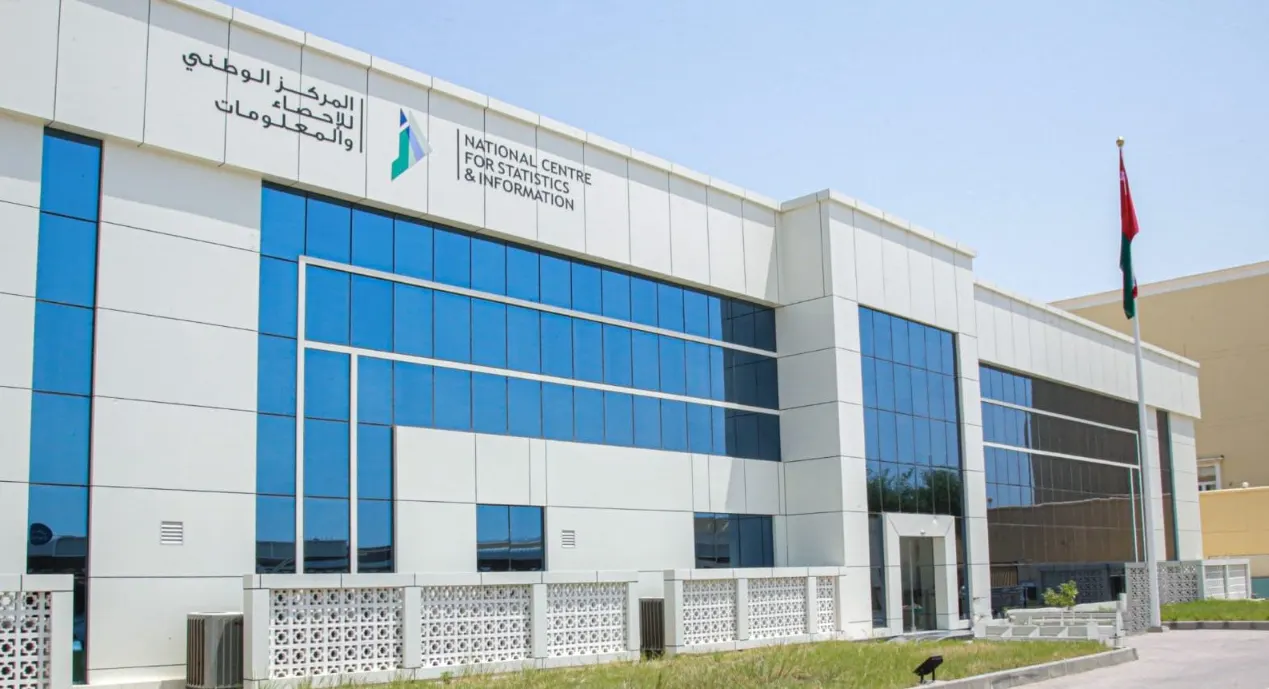
Oman’s merchandise trade surplus widened 37.2 percent in the first five months of 2026, to OMR 3.368 billion from OMR 2.455 billion a year earlier. The headline is strong. The composition is where the interest lies.
National Centre for Statistics and Information data show total merchandise exports rising 10.1 percent to OMR 10.589 billion from OMR 9.620 billion, while imports rose 0.8 percent to OMR 7.221 billion from OMR 7.165 billion. The surplus expansion came almost entirely from export growth rather than from any compression in imports.
| Trade indicator | Jan–May 2026 | Jan–May 2025 | Change |
|---|---|---|---|
| Total exports | OMR 10,589mn | OMR 9,620mn | +10.1% |
| Oil and gas exports | OMR 6,828mn | OMR 6,299mn | +8.4% |
| Non-oil exports | OMR 2,739mn | OMR 2,698mn | +1.5% |
| Re-exports | OMR 1,021mn | OMR 623mn | +64.0% |
| Imports | OMR 7,221mn | OMR 7,165mn | +0.8% |
| Trade surplus | OMR 3,368mn | OMR 2,455mn | +37.2% |
Where the growth came from
Exports rose approximately OMR 969 million year on year. Oil and gas supplied about OMR 529 million of that, roughly 55 percent. Re-exports supplied about OMR 398 million, roughly 41 percent. Non-oil exports supplied about OMR 41 million, just over 4 percent.
Published components sum to OMR 1 million less than the printed total because the bulletin reports in whole millions, but the conclusion is unaffected: hydrocarbons and re-exports together account for approximately 96 percent of the increase in Oman’s export earnings.
Why the re-export number matters
A re-export is a good that arrives in Oman and leaves again. It generates real value through ports, warehousing, freight, finance and logistics, but the merchandise itself is not domestically produced in the way an Omani manufactured or processed export is. Re-exports were 6.5 percent of total exports a year ago; they are now 9.6 percent.
The destinations show what is being routed. The United Arab Emirates took OMR 433 million of Oman’s re-exports, roughly 42 percent of the total and up 75 percent year on year. Iran followed at OMR 173 million and Saudi Arabia at OMR 165 million, the latter up from OMR 45 million.
The same partner dominates the rest of the account. The UAE was Oman’s largest non-oil export destination at OMR 645 million, up 33 percent, ahead of Saudi Arabia at OMR 283 million and India at OMR 280 million. On the import side the UAE supplied OMR 1,941 million, ahead of China at OMR 986 million and Turkey at OMR 550 million, the last up from OMR 95 million.
That places the UAE at roughly 24 percent of Oman’s non-oil exports, 42 percent of its re-exports and 27 percent of its imports.
What it means
At the rial’s peg of 2.6008 to the dollar, the five-month surplus is equivalent to approximately $8.8 billion, on exports of about $27.5 billion and imports of about $18.8 billion. That is a substantial external cushion.
But a surplus expansion driven 55 percent by hydrocarbons and 41 percent by goods in transit is a different achievement from one driven by domestic production. Non-oil exports — the metric Oman’s diversification programme is measured against — grew 1.5 percent over five months and stand at 25.9 percent of total exports, broadly unchanged as the export base expanded.
The variable to watch in the second half is not the size of the surplus. It is whether domestically produced non-oil exports begin contributing materially more than four percent of export growth.
Sources
National Centre for Statistics and Information, Oman, Monthly Statistical Bulletin, July 2026, Tables 5 and 6 · Central Bank of Oman. Calculations by The Edge Research Team.