Saudi Real Estate Prices Rise 1.2 Percent on the Year as Riyadh Gains 4.6 Percent
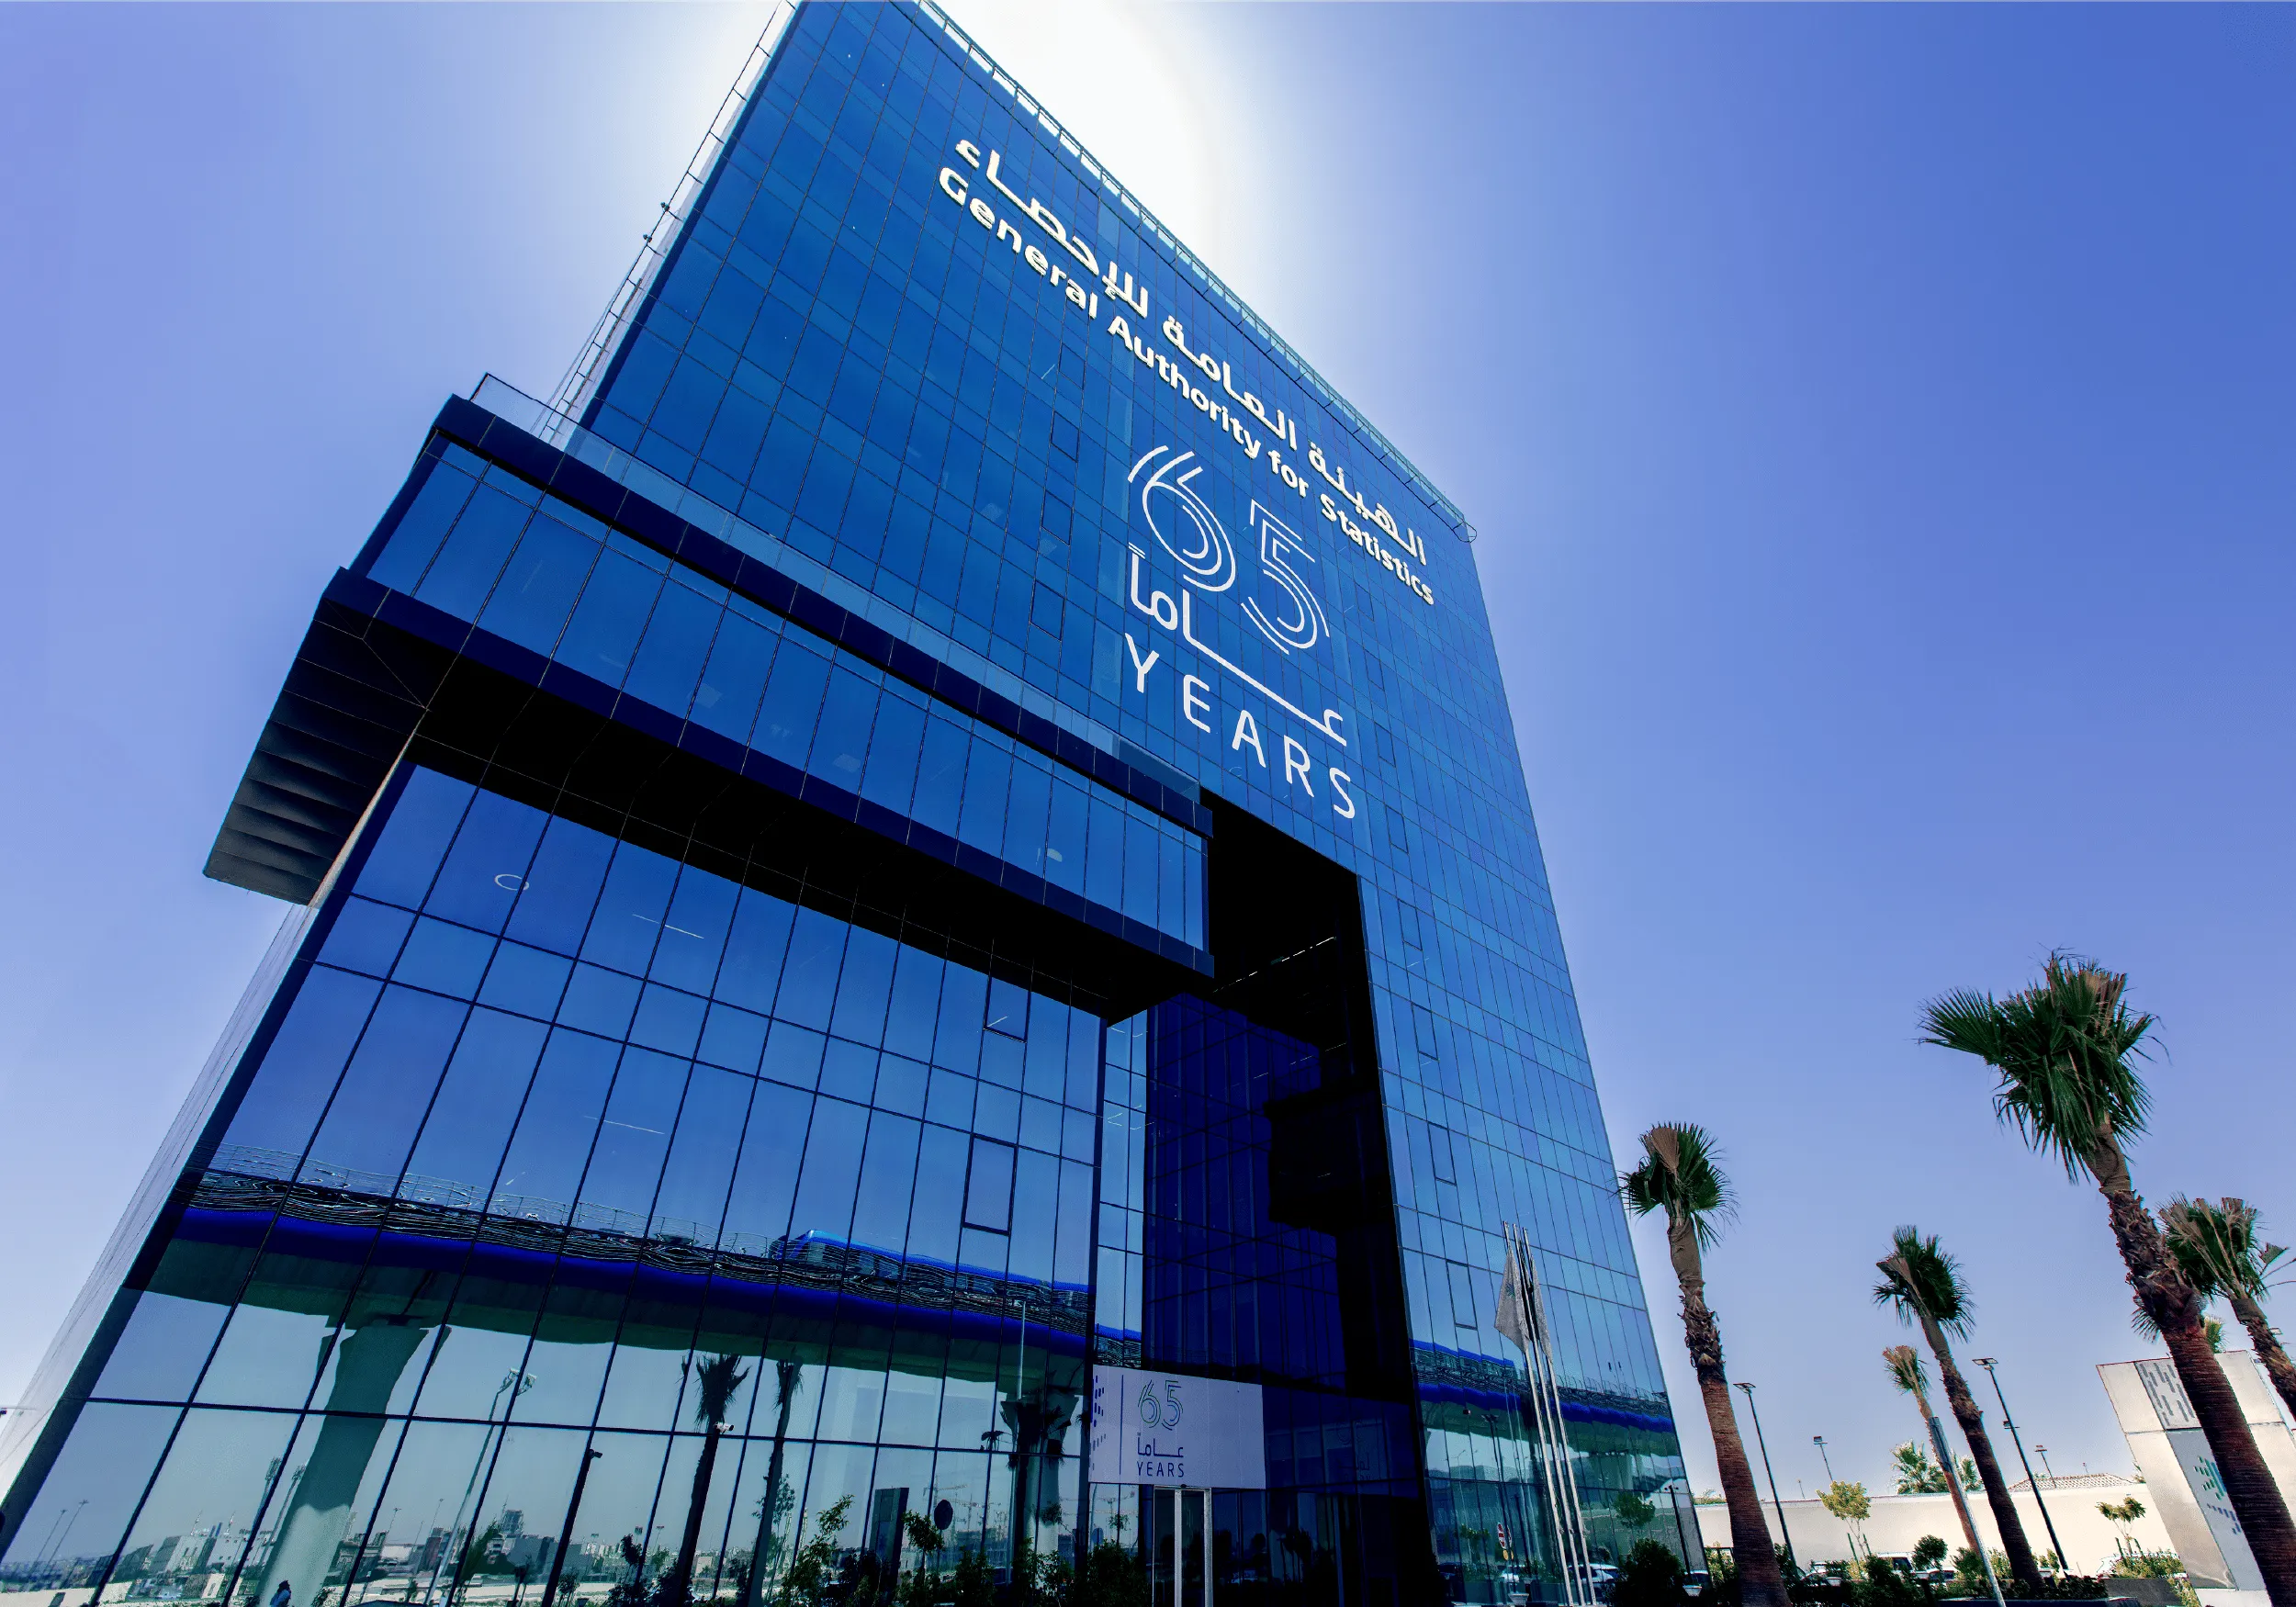
Saudi Arabia’s Real Estate Price Index rose 1.2 percent in the third quarter of 2026 from a year earlier, according to the General Authority for Statistics (GASTAT). It is the second straight quarter of annual growth. Residential and agricultural prices drove the gain. Housing climbed 2.3 percent. Within it, land rose fastest, by 4.9 percent.
The capital region stood out. Prices in Riyadh rose 4.6 percent, a little quicker than the 4.2 percent of the second quarter. A year ago, as first published, Riyadh managed 1.0 percent. On our calculation the pace has picked up by 3.6 percentage points.
The same release day brought the monthly business indicators for August. The Operating Revenues Index rose 3.0 percent from August 2025, and 16 of its 17 activities grew, on our count.
Residential prices gain on the year for a second quarter
In the first quarter of 2026 residential prices were 3.6 percent lower than a year before. Two quarters later they are 2.3 percent higher. That is a swing of 5.9 percentage points on our calculation.
Apartments and residential floors are picking up. Apartments rose 1.7 percent, up from 1.1 percent in the second quarter. Residential floors added 0.8 percent, double the 0.4 percent of the quarter before.
Agricultural prices kept rising too, by 3.9 percent. That is slower than the 11.3 percent of the second quarter, but it extends a run of annual gains through each of the last four releases.
Annual Price Change by Sector, Last 3 Quarters
| Sector | Q1 2026 | Q2 2026 | Q3 2026 |
|---|---|---|---|
| General index | -1.6% | 1.3% | 1.2% |
| Residential | -3.6% | 2.6% | 2.3% |
| Commercial | 3.4% | -3.2% | -2.0% |
| Agricultural | 11.8% | 11.3% | 3.9% |
Change against the same quarter a year earlier. Index base year 2023; the commercial sector carries a 25.4 percent weight.
The balance between housing and commercial property has flipped in a year. In the third quarter of 2025, commercial prices were up 6.8 percent while residential prices slipped 0.9 percent. That put commercial 7.7 points ahead. Today residential leads by 4.3 points, a 12.0-point swing on our calculation.
The four quarterly changes from the fourth quarter of 2025 to the third quarter of 2026 compound to a 1.15 percent rise on our calculation, in line with the published 1.2 percent annual rate.
Riyadh and Northern Borders lead the regional map
Northern Borders posted the fastest annual rise, at 12.0 percent, up from 4.6 percent in the second quarter. A year earlier the region was 7.7 percent lower, so its annual rate has moved 19.7 points on our calculation. Riyadh came second at 4.6 percent.
Madinah turned positive. Its prices rose 0.3 percent after a 4.5 percent fall in the second quarter and an 8.0 percent fall a year ago. On our calculation, Hail’s annual rate improved by 6.3 points from the second quarter, and Al Qaseem’s by 4.1 points. In all, 6 of the 13 regions posted a better annual rate than in the second quarter, on our count. Tabouk’s rate was the same in both quarters.
Annual Price Change by Region, Q2 to Q3 2026
| Region | Q2 2026 | Q3 2026 | Change, points |
|---|---|---|---|
| Northern Borders | 4.6% | 12.0% | 7.4 |
| Riyadh | 4.2% | 4.6% | 0.4 |
| Madinah | -4.5% | 0.3% | 4.8 |
| Al Baha | -2.8% | -0.3% | 2.5 |
| Makkah | 0.4% | -0.6% | -1.0 |
| Al Qaseem | -5.4% | -1.3% | 4.1 |
| Najran | -0.5% | -1.5% | -1.0 |
| Tabouk | -1.7% | -1.7% | 0.0 |
| Jazan | -0.4% | -1.8% | -1.4 |
| Al Jouf | 10.4% | -2.8% | -13.2 |
| Eastern Province | -2.5% | -3.7% | -1.2 |
| Hail | -10.1% | -3.8% | 6.3 |
| Aseer | -1.4% | -4.3% | -2.9 |
Change against the same quarter a year earlier, ranked by the Q3 2026 rate. The points column is our calculation.
On our count, 10 regions recorded annual declines, against 9 in the second quarter. Al Jouf moved from the top of the second-quarter ranking, at 10.4 percent, to a 2.8 percent fall.
Commercial and villa annual rates improve
Two laggards of the second quarter improved. Commercial prices were 2.0 percent lower than a year earlier, a smaller fall than the 3.2 percent of the second quarter.
Land dominates this sector. The year-ago release put commercial land at 22.8 percent of the index weight, which is 89.8 percent of the commercial sector’s 25.4 percent on our calculation. The rest of the index, 74.6 percent of the base-year weight, did the lifting.
Villas improved too. Their prices were 7.7 percent lower than a year earlier, against a 9.7 percent fall in the second quarter. On our calculation, the gap between residential land and villas narrowed to 12.6 points from 16.0 points.
Residential Prices by Category
| Category | Annual, Q2 2026 | Annual, Q3 2026 | Quarterly, Q3 2026 |
|---|---|---|---|
| Residential land | 6.3% | 4.9% | -2.1% |
| Apartments | 1.1% | 1.7% | -0.5% |
| Residential floors | 0.4% | 0.8% | 1.0% |
| Villas | -9.7% | -7.7% | -0.4% |
Annual change is against the same quarter a year earlier; quarterly change is against Q2 2026.
On a quarterly basis the index fell 1.2 percent from the second quarter. The index also fell 1.1 percent on the quarter in the third quarter of 2025, so the dip has come in both years. Residential floors rose 1.0 percent on the quarter.
Business revenues grow 3.0 percent in August
Transport and storage revenues grew fastest in August, at 17.0 percent from a year earlier. Electricity, gas, steam and air conditioning came next, at 16.8 percent.
Real estate activities, the property link to the price index, grew 5.9 percent. Pay grew faster than revenue. The Employees Compensation Index rose 6.3 percent, 3.3 points above the revenue gain on our calculation. Manufacturing pay rose 9.7 percent.
Operating Revenues by Activity, August 2026
| Activity | Annual change |
|---|---|
| Transportation and storage | 17.0% |
| Electricity, gas, steam and air conditioning | 16.8% |
| Financial and insurance | 10.8% |
| Manufacturing | 7.7% |
| Water supply and sewerage | 6.4% |
| Real estate activities | 5.9% |
| Information and communication | 5.8% |
| Construction | 3.2% |
| Wholesale and retail trade | 2.2% |
| Mining and quarrying | -11.6% |
| All activities | 3.0% |
Preliminary results, change against August 2025. Selected activities; the other 7 grew between 1.1 and 4.1 percent.
Mining and quarrying was the only activity with lower revenue than a year earlier, down 11.6 percent. On the month, the index slipped 1.1 percent from July. Building permits fell 19.7 percent from a year earlier, to 5,621. That is 1,377 fewer than in August 2025, on our calculation.
Why it matters: Saudi property prices are higher than a year earlier for a second straight quarter. Riyadh is rising faster than in the second quarter. Apartments and residential floors are up on the year too, so the gains reach beyond plots of land.
Outlook: The fourth-quarter index will show whether housing can deliver a third straight quarter of annual growth. Riyadh and Northern Borders set the pace to watch. The September business indicators come next. In August, 16 of 17 activities grew, on our count.
Sources: General Authority for Statistics, The Edge.