Suez Canal tonnage rises 22.4 percent in the fiscal year as tankers displace container ships
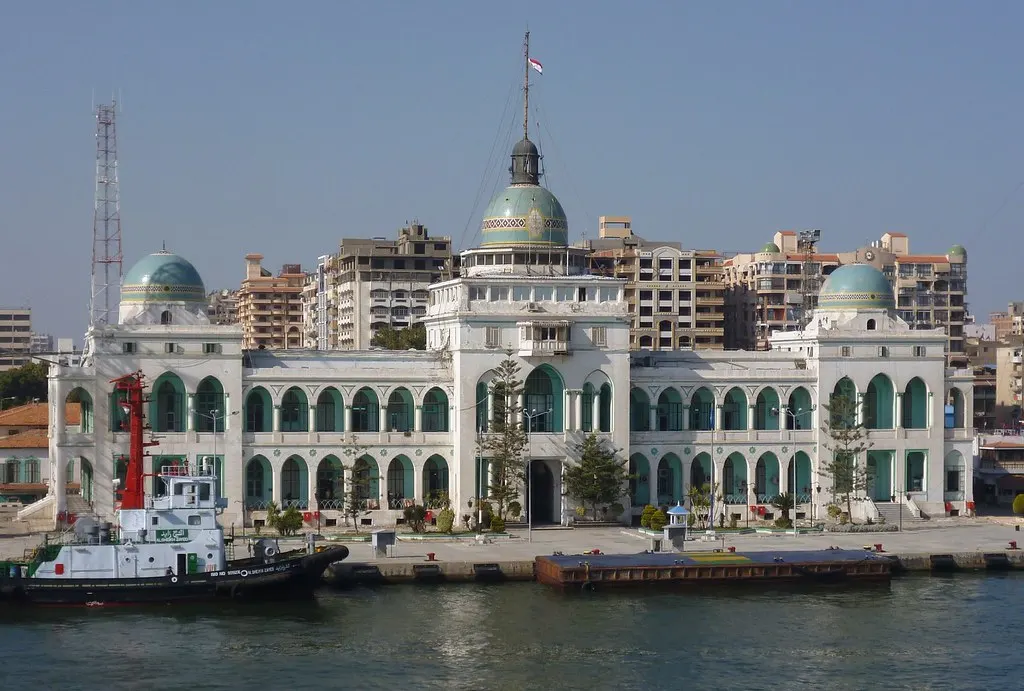
Traffic through the Suez Canal rose to 590.7 million net tons in the fiscal year ended 30 June 2026, up 22.4 percent on the preceding year, with 13,607 transiting vessels against 12,393, on the Suez Canal Authority’s own statistics. Receipts rose faster still. The Central Bank of Egypt recorded 3,225.2 million dollars of canal dues in the 9 months to March, up 22.1 percent on the same period a year earlier.
The recovery is real and it is narrow. Net tonnage has regained 38.7 percent of its fiscal 2022/23 level, on our calculation, and the cargo mix behind that number has inverted: the canal is now carrying tankers where it used to carry container ships.
The fiscal year, on the Authority’s own numbers
| Fiscal year | Vessels | Net tonnage |
|---|---|---|
| 2022/23 | 25,911 | 1,526.9 M |
| 2023/24 | 20,148 | 1,074.6 M |
| 2024/25 | 12,393 | 482.8 M |
| 2025/26 | 13,607 | 590.7 M |
Suez Canal Authority navigation statistics, Egyptian fiscal years running 1 July to 30 June. Fiscal 2025/26 completed on 30 June 2026 and is the most recent full period the Authority has published.
Two things separate this recovery from a simple rebound. Vessel numbers rose 9.8 percent while net tonnage rose 22.4 percent, on our calculation, so the average ship is substantially larger than it was a year ago. And the gain runs entirely through the second half of the fiscal year: the Authority’s quarterly data show 3,324 vessels and 142.9 million net tons in the first calendar quarter of 2026, rising to 3,580 vessels and 163.9 million tons in the second.
There is a useful cross check between the two institutions. The central bank reports 426.9 million net tons for the 9 months to March, and the Authority reports 590.7 million for the full fiscal year, which implies 163.8 million tons in the April to June quarter, on our calculation. The Authority separately publishes 163.9 million tons for calendar second quarter 2026. The two series agree to within 0.1 million tons.
Receipts are growing faster than volume
| Canal dues, dollars mn | Period |
|---|---|
| 8,759.6 | Fiscal 2022/23 |
| 6,632.4 | Fiscal 2023/24 |
| 3,616.0 | Fiscal 2024/25 |
| 3,225.2 | 9 months to March 2026 |
Central bank balance of payments data, Egyptian fiscal years, described as preliminary. The 9 month figure compares with 2,642.2 million dollars in the same period a year earlier.
Nine months of fiscal 2025/26 have already produced 89.2 percent of the entire preceding fiscal year’s receipts, on our calculation. More telling is the relationship between money and volume: receipts rose 22.1 percent against a 18.5 percent rise in net tonnage over the same 9 months, so revenue grew 3.6 percentage points faster than the tonnage it was charged on.
That works out at roughly 7.56 dollars per net ton in the 9 months to March against roughly 7.33 dollars a year earlier, a gain of about 3.0 percent, on our calculation.
One obvious explanation does not fit. By Periodical No. 3 of 2026, issued on 2 April, the Authority suspended a 15 percent rebate from 7 April, roughly 12 weeks before it was due to expire on 30 June. But that rebate was never a general discount. It applied only to container ships of 130,000 Suez Canal net tons or above, laden or ballast, in either direction, granted automatically on transit. It was introduced in May 2025 and renewed twice. Its withdrawal falls in the fourth quarter of the fiscal year and therefore sits outside the 9 month figures entirely, so whatever lifted revenue per ton through March, this is not it.
The cargo has changed, not just the volume
| Share of net tonnage | Q2 2026 | 2023 |
|---|---|---|
| Tankers | 47.3% | 27% |
| Container ships | 14.7% | 42% |
| Bulk carriers | 22.6% | 19% |
| LNG carriers | 5.0% | 6% |
Authority data, calendar periods. The 2023 shares are for the full calendar year, the most recent complete year before traffic was diverted. The 2023 LNG share is taken from the 2025 report’s own comparison of shares by ship type.
This is the finding the headline tonnage conceals. In 2023 the canal was principally a container route, with container ships accounting for 42 percent of net tonnage and tankers 27 percent. By the second quarter of 2026 the ranking had reversed, with tankers first and container ships a distant second.
The underlying numbers are starker than the shares. Container net tonnage was 72,453 thousand tons in calendar 2025 against 657,033 thousand in 2023, which is 11.0 percent of the 2023 level, on our calculation. Tankers over the same comparison stand at 59.3 percent of their 2023 tonnage and liquefied natural gas carriers at 33.3 percent, on our calculation. Container shipping, historically the canal’s central trade, is the one category that has barely returned.
Calendar 2025 was still the trough on the Authority’s own annual data, at 12,758 vessels and 522.1 million net tons, both marginally below 2024. The turn shows in the monthly series rather than the annual one: 2025 crossed above the corresponding 2024 month from July onward and rose through December, ending at 50.4 million net tons in December against 38.8 million a year earlier. Combining the two published quarters of 2026 gives 6,904 vessels and 306.8 million net tons for the first half, against 6,055 vessels and 238.2 million tons in the same months of 2025, gains of 14.0 percent and 28.8 percent, on our calculation.
What the Authority does not publish
The Authority’s annual navigation reports, published for every year from 2008 to 2025, contain no revenue figure of any kind. They are traffic documents: vessels, net tonnage, cargo tonnage, ship type and direction. The same is true of its navigation statistics portal.
Dollar revenue for the canal therefore comes from two separate official series that are not interchangeable. The central bank publishes canal dues on an Egyptian fiscal year within the balance of payments, which is the series used above. The State Information Service publishes calendar year revenue attributed to the Authority’s own presentations, and on that basis 2023 was a record 10.250 billion dollars, 2022 was 7.934 billion and 2024 was 3.991 billion. No calendar 2025 revenue outturn has been published on that page, which was last updated in September 2025.
Mixing the two bases produces figures that cannot be reconciled, and a fiscal year total and a calendar year total for overlapping periods will not agree.
Why it matters: The canal’s contribution to Egypt’s external accounts has been sharply rescaled since the disruption, and the recovery in tonnage does not undo that. Canal dues were 25.3 percent of Egypt’s services receipts in fiscal 2022/23 and 12.1 percent in the 9 months to March 2026, on our calculation from published lines, which means the country now earns roughly half as much of its services income from the waterway as it did three years ago. The weight has shifted elsewhere in the accounts: remittances, a separate transfers line rather than a services one, reached 34,905.8 million dollars in the same 9 months and are now 10.8 times canal dues, on our calculation. That is a different external funding model, with different sensitivities: the canal responds to shipping route decisions taken abroad, remittances respond to labour markets and the exchange rate. The cargo mix is the second structural point. A canal earning from tankers rather than container ships is exposed to oil and gas flows rather than to manufactured goods trade, and container tonnage at 11.0 percent of its 2023 level, on our calculation, says the liner operators who left have not come back at scale even as total tonnage recovers.
Outlook: The fourth quarter of fiscal 2025/26 is the first period to carry the full transit fee schedule after the 15 percent discount was withdrawn on 7 April, and the balance of payments release covering it will show whether revenue per ton steps up beyond the roughly 3.0 percent gain recorded through March, on our calculation. Container traffic is the variable that decides whether this is a recovery or a change of mix, because tanker and bulk tonnage can carry the aggregate while the highest value category stays absent. Watch the Authority’s third quarter 2026 data, not yet published, for whether the container share moves off 14.7 percent. The central bank has also not yet released full year fiscal 2025/26 balance of payments figures, so the annual receipts total remains open, and its August net international reserves figure was still unpublished as of 5 September against a first week of the month convention.
Sources: Suez Canal Authority, Central Bank of Egypt, State Information Service.