
US Market Wrap 13 October: All Five Indices Slip as the Banks Fall on Beating Estimates
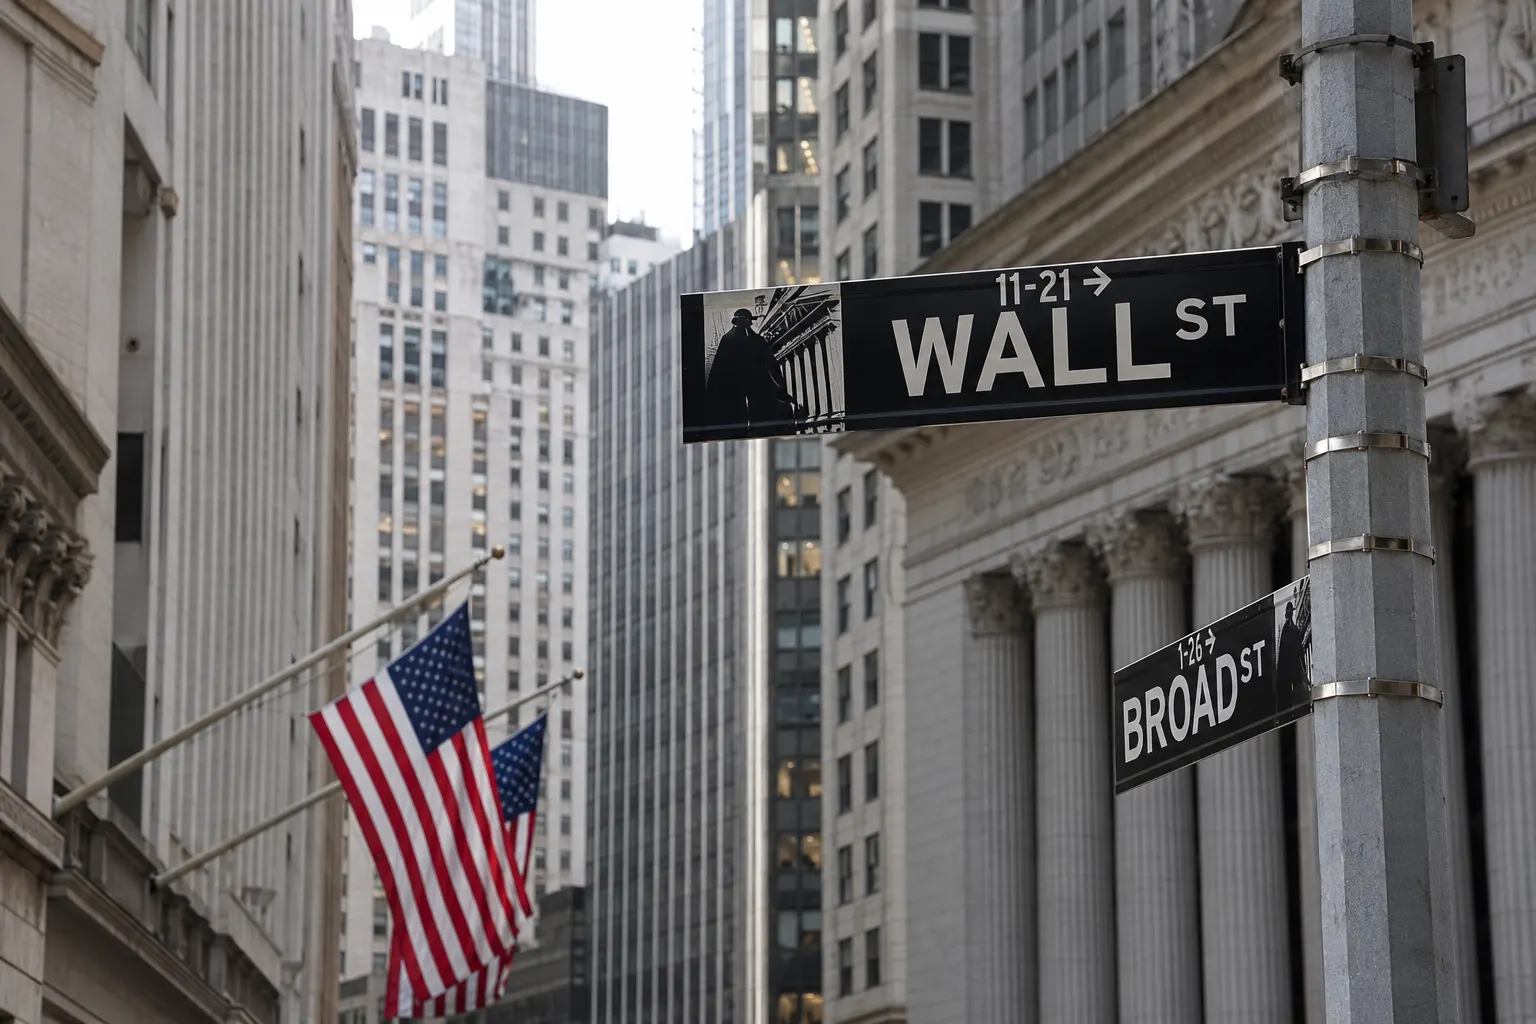
All five US indices closed lower on Tuesday, the S&P 500 by 0.02 percent, as the opening day of the bank reporting season ended with Citigroup down 5.6 percent despite topping profit estimates. The Nasdaq Composite fell 0.15 percent, the Nasdaq 100 0.31, the Dow 0.35 and the small-cap Russell 2000 0.40, ending the Dow’s two-session run. The Treasury’s par yield curve returned from the holiday with the ten-year three basis points lower at 5.21 percent against Friday’s row. Brent settled 0.9 percent lower at 105.69 dollars a barrel and WTI 0.4 percent higher at 94.14, its highest close since 24 September, as Reuters’ updated oil report carried after our Commodities Wrap of 13 October published the session’s 19:04 GMT quotes.
The banks fall on their beats and the chip index makes it five
Reuters’ closing report had the banks selling off on results that mostly beat: Citigroup fell 5.6 percent and Goldman Sachs 0.2 after both topped profit estimates, Wells Fargo lost 3.1 percent after its net interest income missed, and JPMorgan Chase ended 0.9 percent lower after what a separate Reuters report called a rare profit miss, with dealmaking and bond trading losing momentum. The chip complex kept paying for Asia’s storm: the Philadelphia semiconductor index fell 0.23 percent in a fifth straight decline, down more than 8 percent over those five sessions though still up over 70 percent on the year, after Broadcom’s chief executive likened some of the sector’s investment flows to casino gambling and reports of advances by the Chinese memory-chip company CXMT fed the competition worry that had sunk Seoul in the morning; Micron lost 3.6 percent and Applied Materials almost 7, while Broadcom itself rose 0.7. Apple touched an intraday record of 348.15 dollars before closing 0.1 percent higher at 341.27, a market value of 4.98 trillion dollars. The report had analysts expecting S&P 500 third-quarter earnings to surge more than 30 percent on LSEG data, the index trading under 19 times expected earnings, its cheapest since 2023, and one manager in it describing investors’ relief at a week that might turn on earnings rather than bonds and oil. Elsewhere Johnson & Johnson fell 5.7 percent despite topping estimates, taking health care to the bottom of the sector table, Bumble jumped almost 57 percent on a 1.3 billion dollar deal to go private, and Domino’s Pizza fell 4.8 percent after scaling back its sales outlook. The tape itself leaned the other way: advancers outnumbered decliners 1.1 to one inside the S&P 500, which posted 18 new highs against five new lows while the Nasdaq recorded 47 against 408, on 14.8 billion shares against a 17.6 billion average.
The long end rallies as Williams caps the cycle at one more
The Treasury’s par yield curve, back after Monday’s Columbus Day holiday, came in lower at every published maturity beyond two years against Friday’s row: the two-year eased a basis point to 4.79 percent, the ten-year fell three to 5.21, the thirty-year four to 5.56 and the twenty-year five to 5.60, the deepest move on the curve. New York Fed President John Williams reaffirmed, in a Bloomberg News interview carried by Reuters, that the central bank may need to raise rates once more this year and said he sees no need for a hike in 2027, while PIMCO’s Dan Ivascyn said the peak in Treasury yields is still ahead, and Fed Governor Christopher Waller called the recent rise in yields a reflection of stronger growth with inflation expectations well anchored. CME’s FedWatch tool priced a 19 percent chance of a hike this month and an 88 percent chance by December, per Reuters’ gold report. On the sector board five of the eleven S&P 500 groups rose even as every index fell, the reverse of Monday’s eight-of-eleven: energy led at 1.74 percent on WTI’s highest close since 24 September, communication services added 0.88 and utilities 0.57, while health care’s 1.33 percent fall was the deepest and the financials gave up 0.41 on the banks’ day.
Top gainers
| Index | Close | Change |
|---|---|---|
| Nil |
No index on the board rose on Tuesday 13 October 2026; all five fell and are ranked in the losers table below.
Top losers
| Index | Close | Change |
|---|---|---|
| S&P 500 | 7,805.45 | -0.02% |
| Nasdaq Composite | 27,204.38 | -0.15% |
| Nasdaq 100 | 30,569.48 | -0.31% |
| Dow Jones Industrial Average | 51,670.10 | -0.35% |
| Russell 2000 | 2,783.37 | -0.40% |
Closes of Tuesday 13 October 2026 from the price feed, ranked from the shallowest to the deepest decline against Monday’s closes as published; the Dow’s two-session run ends, and the other four are in second straight declines. Run lengths are counted against our published closes.
S&P 500 sectors
| Sector | Close | Change |
|---|---|---|
| Energy | 1,032.14 | +1.74% |
| Communication Services | 481.74 | +0.88% |
| Utilities | 425.17 | +0.57% |
| Consumer Staples | 943.56 | -0.33% |
| Financials | 911.95 | -0.41% |
| Health Care | 1,979.49 | -1.33% |
The three strongest and three weakest of the eleven sectors, same read and basis; omitted middle: materials +0.37 percent at 633.10, technology +0.08 at 7,320.65, consumer discretionary -0.08 at 1,871.09, real estate -0.28 at 267.62, industrials -0.29 at 1,427.53.
US Treasury par yield curve
| Maturity | 13 Oct | 9 Oct | Change |
|---|---|---|---|
| 2 Year | 4.79% | 4.80% | -1 bp |
| 3 Year | 4.90% | 4.89% | +1 bp |
| 5 Year | 5.00% | 5.02% | -2 bp |
| 10 Year | 5.21% | 5.24% | -3 bp |
| 30 Year | 5.56% | 5.60% | -4 bp |
The official daily par yield curve for 13 and 9 October 2026, read at the US Treasury’s own daily table, with the 9 October row exact to our published record; the Treasury published no curve on Monday’s Columbus Day holiday, so the changes, which are ours, span the long weekend. Omitted maturities on 13 October: 1 month 4.10 percent, 1.5 month 4.15, 2 month 4.15, 3 month 4.26, 4 month 4.32, 6 month 4.34, 1 year 4.48, 7 year 5.11, 20 year 5.60, the last five basis points below Friday and the curve’s deepest move.
Commodities
| Contract | Level | Change |
|---|---|---|
| Gold, COMEX (Dec’26), dollars an ounce | $4,186.40 | -0.10% |
| Silver, COMEX (Dec’26), dollars an ounce | $59.54 | -1.61% |
| Brent Crude, ICE (Dec’26), dollars a barrel | $105.73 | -0.86% |
| WTI Crude, NYMEX (Nov’26), dollars a barrel | $94.18 | +0.47% |
Carried unchanged from our Commodities Wrap of 13 October 2026 on its stated 19:04 GMT snapshot basis, measured against Monday’s settlements of 106.65 and 93.74 dollars for the crudes, as published there; gold’s own December settlement of 4,177.30 dollars is in that wrap’s lede. The Brent and WTI settlements reported by the wire were 105.69 dollars (down 0.9 percent) and 94.14 dollars (up 0.4 percent). Fixed row order.
Currencies, volatility and crypto
| Instrument | Level | Change |
|---|---|---|
| VIX | 15.27 | +0.39% |
| US Dollar Index (DXY) | 102.18 | -0.41% |
| Euro/Dollar | 1.1197 | +0.40% |
| Sterling/Dollar | 1.3253 | +0.37% |
| Dollar/Yen | 158.34 | -0.19% |
| Bitcoin | $83,450.50 | +1.00% |
Quotes at 22:49 GMT, in fixed order; snapshots, not settlements. The VIX and bitcoin rows carry the feed’s own changes; the currency rows are measured against Monday’s published rows, the feed’s previous values having rolled to the new currency day at this hour.
Asia, session of Tuesday 13 October
| Index | Close | Change |
|---|---|---|
| Nifty 50 (India) | 22,721.95 | +1.60% |
| Hang Seng (Hong Kong) | 24,345.22 | +0.30% |
| Straits Times (Singapore) | 5,430.50 | +0.28% |
| Topix (Japan) | 4,110.67 | +0.14% |
| Shanghai Composite (China) | 3,800.86 | +0.10% |
| S&P/ASX 200 (Australia) | 8,783.90 | +0.01% |
| Shenzhen Component (China) | 12,353.70 | -0.25% |
| Nikkei 225 (Japan) | 67,777.52 | -1.82% |
| Taiex (Taiwan) | 48,341.31 | -1.95% |
| Kospi (South Korea) | 6,035.35 | -5.46% |
Carried whole from our Asia Market Wrap of 13 October 2026, gainers then losers in its published order; the Topix and Nikkei rows are measured against their 9 October closes across the Sports Day holiday, and the Nifty row is the exchange’s own figure, as disclosed there.
Middle East, session of Tuesday 13 October
| Index | Close | Change |
|---|---|---|
| DFM General (Dubai) | 5,858.87 | +0.36% |
| Tadawul All Share (Saudi Arabia) | 10,318.14 | +0.33% |
| FTSE ADX General (Abu Dhabi) | 9,793.64 | +0.33% |
| ASE Index (Jordan) | 4,180.95 | +0.32% |
| QE Index (Qatar) | 8,992.33 | +0.17% |
| Boursa Kuwait All-Share (Kuwait) | 8,654.84 | +0.06% |
| Bahrain All Share (Bahrain) | 1,882.51 | +0.02% |
| EGX 30 (Egypt) | 51,265.27 | -0.68% |
| MSX 30 (Oman) | 7,728.058 | -0.97% |
Carried whole from our Middle East Market Wrap of 13 October 2026, gainers then losers in its published order; three losing streaks ended there, as disclosed.
Europe, session of Tuesday 13 October
| Index | Close | Change |
|---|---|---|
| SMI (Switzerland) | 13,927.52 | +0.36% |
| FTSE MIB (Italy) | 50,057.18 | +0.04% |
| FTSE 100 (UK) | 10,650.33 | -0.06% |
| CAC 40 (France) | 7,827.63 | -0.07% |
| DAX (Germany) | 25,259.90 | -0.07% |
| STOXX Europe 600 (Europe) | 635.01 | -0.10% |
| IBEX 35 (Spain) | 19,210.70 | -0.39% |
| AEX (Netherlands) | 1,129.32 | -0.54% |
| Euro STOXX 50 (euro area) | 6,167.01 | -0.55% |
Carried whole from our Europe Market Wrap of 13 October 2026, its gainers then its losers in their published order; seven of the nine closed lower, as disclosed there.
Why it matters: The reporting season’s first day repriced the banks’ good news, not their bad: the falls came on beats, which reads as positioning unwinding into results the market had already paid for. The index shape was the mirror of the morning’s: Riyadh and the euro area’s big names decided those boards against their own breadth, while New York’s tape held, with more stocks rising than falling inside an index that closed lower, so the heavyweights slipped and the market underneath did not. The bond market took the other side of the Fed’s talk, the long end rallying through a one-more-hike message, which is a curve starting to price the end of the cycle rather than its extension. Energy’s lead on a day the US benchmark closed at a three-week high while Brent eased says the premium is becoming a local story, and Wednesday’s inflation print arbitrates all of it.
Outlook: Our Asia wrap follows on Wednesday, reading the chip complex’s reaction to a fifth straight Philadelphia decline, and Tokyo’s second session back. Wednesday brings the US consumer inflation report, China’s September inflation data and the IEA’s Monthly Oil Market Report, with US producer prices and Fed Chair Kevin Warsh’s last remarks before the meeting on Thursday, as published in our Week Ahead of 11 to 17 October.
How these wraps are prepared: Methodology.
Sources: CNBC, Reuters, US Department of the Treasury, The Edge.





