US Market Wrap 15 September: All 5 Indices Fall as the 10 Year Reaches 5 Percent Before the Fed
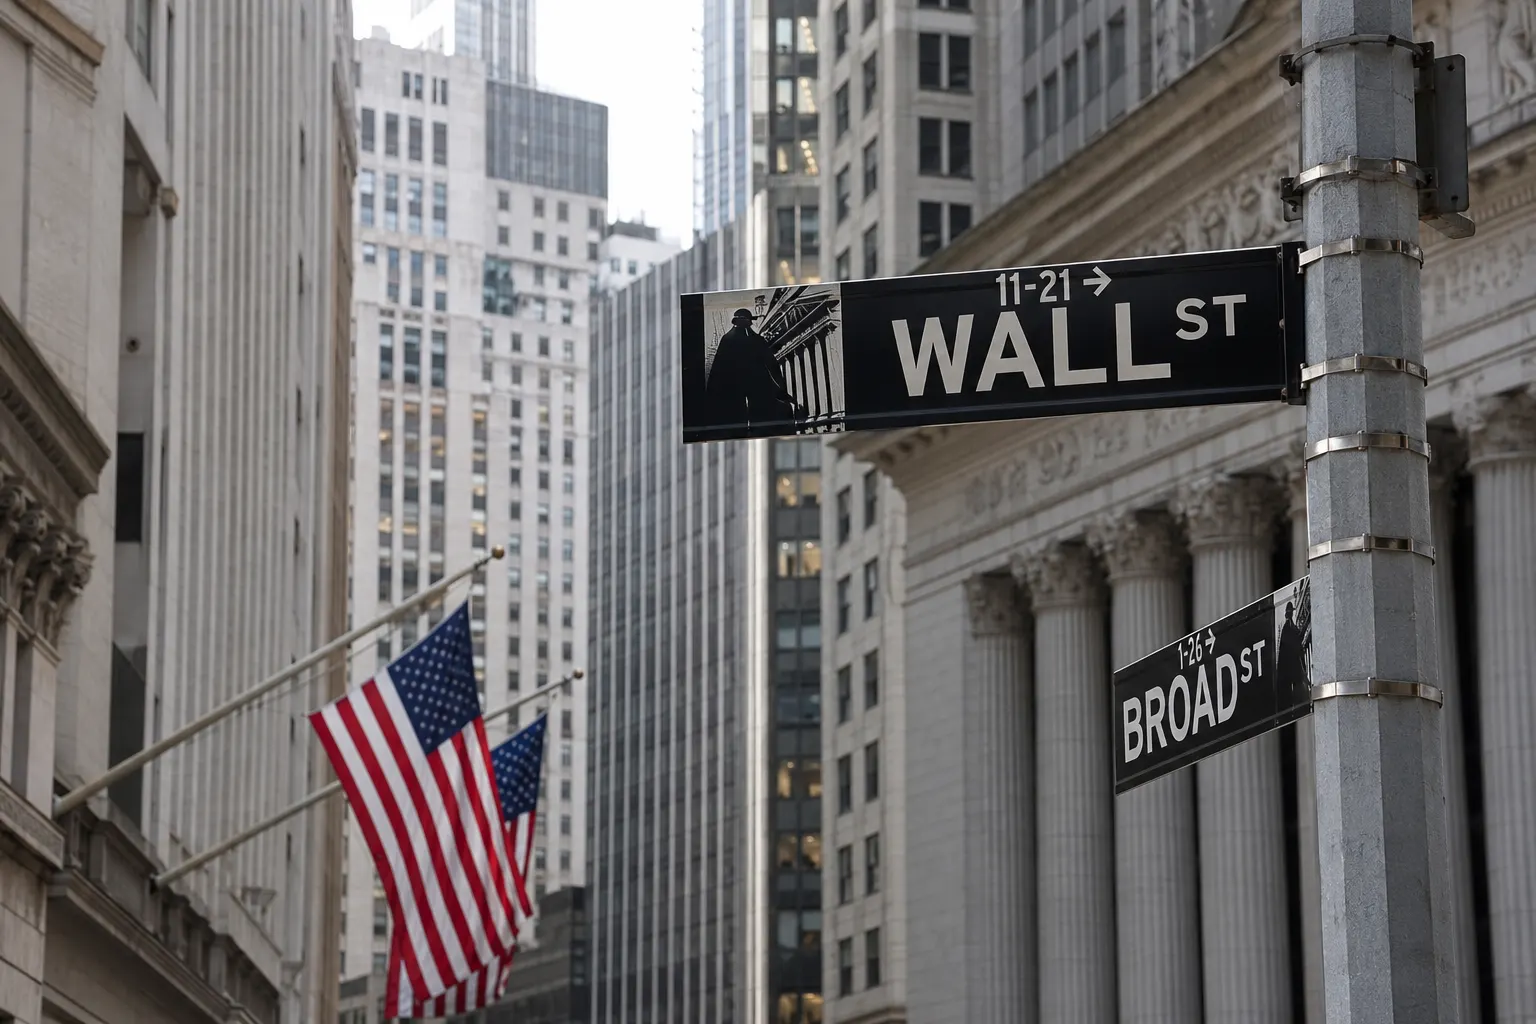
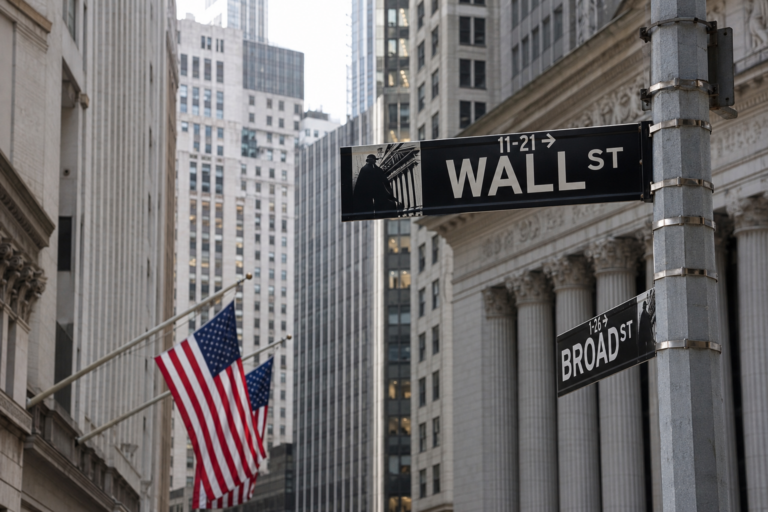
Every index on our board fell on Tuesday with the benchmark 10 year Treasury yield at 5 percent on the eve of the Federal Reserve’s decision. The S&P 500 lost 34.25 points, or 0.45 percent, to close at 7,585.73, its 6th decline in 7 sessions on our count, the Dow Jones Industrial Average shed 328.09 points, or 0.63 percent, to 52,093.11, and the Nasdaq Composite dropped 0.78 percent to 25,981.57, per CNBC’s closing report, with every close from the vendor’s feed at 20:19 GMT. Energy was the day’s only meaningful sector bid, up 2.26 percent, and just 2 of the 11 S&P 500 sectors rose. Brent crude settled 2.9 percent higher at 108.75 dollars a barrel, per our Commodities Wrap of 15 September 2026.
The 10 year holds 5 percent into the decision
The bond market set the day’s terms. The 10 year yield rose above the 5 percent threshold overnight to a peak the network’s reporting called its highest since 2007, trading at 5.025 percent in the early hours US time, and the official par curve closed the 10 year at 5.00 percent, up 3 basis points on our calculation from the daily readings, with the rise running through the whole coupon curve: the 2 year added 2 basis points to 4.67 percent, the 5 year 3 to 4.83 and the 30 year 2 to 5.36. The decision comes Wednesday, and the network’s Fed survey found 86 percent of respondents now expect a rise over the next year, from 46 percent a month earlier, with 55 percent expecting more than a single one. Wolfe Research wrote there is a 90 percent probability of a rise at Wednesday’s meeting after last week’s inflation reports, while putting its own odds at 50 50 and adding that “Chair Warsh is a wildcard given the Fed’s newfound lack of forward guidance.” BlackRock’s global fixed income chief investment officer Rick Rieder said he expects the rise but would not make it himself, arguing a quarter point does little against inflation driven by war, energy and services costs, and noted that historically a 10 year at 5 percent has been a good forward entry point for buying rates. The level’s equity casualties were the dividend proxies: the utilities select sector fund fell about 1 percent to a fresh 52 week low, its lowest since September 2025 per the same reporting, as the 5 percent risk free rate competes directly with the sector’s yields, and our board’s utilities reading closed 1.20 percent lower. Wells Fargo trimmed its year end S&P 500 target to 7,700 from 7,950, arguing the market is entering the late innings of the cycle with 5 to 10 percent downside risk.
Energy stands alone while crypto sells off
The sector board reduced the session to one line: energy rose 2.26 percent and materials 0.37 percent, and nothing else closed higher. Crude did the lifting. By 17:00 GMT, Brent traded up 3 percent at 108.88 dollars a barrel and WTI 4.7 percent higher at 106.12, per CNBC’s energy report, which put the month’s advance near 20 percent as traders awaited word on how long Saudi Arabia’s East West pipeline will stay shut; the contracts went on to settle at 108.75 and 105.83 dollars, per our Commodities Wrap of 15 September 2026, which carries the full supply picture from Yanbu to Libya. At the other end, consumer discretionary lost 1.76 percent, the board’s worst, with utilities and consumer staples behind it, and the damage matched the shape of the rates day rather than any single earnings story. Risk came out of crypto in parallel: bitcoin fell 4.03 percent to 75,889.84 dollars and ether 5.49 percent to 2,402.24, both at 20:19 GMT on the vendor’s daily basis, extending the slide our commodities wrap flagged earlier. The dollar index added 0.26 percent to 99.651 and the yen weakened 0.49 percent to 155.11 per dollar.
Top gainers
| Index | Close | Change |
|---|---|---|
| Nil | Nil | Nil |
Top gainers, closes of Tuesday 15 September 2026 from the vendor’s feed at 20:19 GMT. No index on the board rose; all 5 fell and are ranked in the losers table below.
Top losers
| Index | Close | Change |
|---|---|---|
| S&P 500 | 7,585.73 | -0.45% |
| Dow Jones Industrial Average | 52,093.11 | -0.63% |
| Nasdaq 100 | 28,937.84 | -0.65% |
| Russell 2000 | 2,870.29 | -0.76% |
| Nasdaq Composite | 25,981.57 | -0.78% |
Top losers, closes of Tuesday 15 September 2026 from the vendor’s feed at 20:19 GMT, ranked by change; every change is measured against our published 14 September closes.
S&P 500 sectors
| Sector | Change |
|---|---|
| Energy | +2.26% |
| Materials | +0.37% |
| Health care | -0.08% |
| Consumer staples | -0.85% |
| Utilities | -1.20% |
| Consumer discretionary | -1.76% |
Top 3 and bottom 3 of the 11 S&P 500 sectors, closes of Tuesday 15 September 2026 from the vendor feed at 20:19 GMT, ranked; changes are our recomputation against the prior closes the feed carries. Omitted mid table: Real estate, down 0.23 percent, Information technology, down 0.34, Financials, down 0.34, Industrials, down 0.64, and Communication services, down 0.84.
US Treasury par yield curve
| Maturity | 15 Sep | 14 Sep | Change |
|---|---|---|---|
| 2 year | 4.67% | 4.65% | +2bp |
| 3 year | 4.76% | 4.73% | +3bp |
| 5 year | 4.83% | 4.80% | +3bp |
| 10 year | 5.00% | 4.97% | +3bp |
| 30 year | 5.36% | 5.34% | +2bp |
The official daily par yield curve for 15 and 14 September 2026, read at 20:44 GMT; the Treasury derives the curve from indicative bid side quotations at about 19:30 GMT in US summer time, and the changes are ours. Omitted maturities on 15 September: 1 month 3.93 percent, 3 month 4.11, 6 month 4.17, 1 year 4.39, 7 year 4.91 and 20 year 5.40.
Commodities
| Contract | Level | Change |
|---|---|---|
| Gold, COMEX (Dec’26), dollars an ounce | $4,349.30 | -0.06% |
| Silver, COMEX (Dec’26), dollars an ounce | $64.36 | +0.35% |
| Brent Crude, ICE (Nov’26), dollars a barrel | $108.52 | +2.69% |
| WTI Crude, NYMEX (Oct’26), dollars a barrel | $105.80 | +4.35% |
Carried verbatim from our Commodities Wrap of 15 September 2026: levels after the settlement window at 19:00 GMT on Tuesday 15 September 2026, measured against Monday’s settlements as carried in the price feed; post settlement snapshots, not the official settlements, contract months as displayed. The Brent and WTI settlements reported by the network were 108.75 dollars (up 2.9 percent) and 105.83 dollars (up 4.4 percent). Fixed row order.
Currencies, volatility and crypto
| Instrument | Level | Change |
|---|---|---|
| Cboe Volatility Index | 17.20 | +0.58% |
| Bitcoin, dollars | 75,889.84 | -4.03% |
| US Dollar Index (DXY) | 99.651 | +0.26% |
| Euro/Dollar | 1.1539 | -0.07% |
| Sterling/Dollar | 1.3469 | -0.19% |
| Dollar/Yen | 155.11 | +0.49% |
Intraday quotes at 20:19 GMT, fixed row order; the VIX row is the session’s last print on the vendor’s feed, and every change in this table is on the vendor’s daily basis.
Asia, session of Tuesday 15 September 2026
| Index | Close | Change |
|---|---|---|
| Nikkei 225 (Japan) | 63,484.10 | -0.01% |
| Topix (Japan) | 4,037.16 | -0.52% |
| Shanghai Composite (China) | 3,864.28 | -0.54% |
| Shenzhen Component (China) | 13,287.97 | -0.72% |
| Taiex (Taiwan) | 45,511.49 | -0.77% |
| Kospi (South Korea) | 6,627.26 | -0.85% |
| S&P/ASX 200 (Australia) | 8,672.50 | -0.88% |
| Hang Seng (Hong Kong) | 24,667.24 | -1.00% |
| Nifty 50 (India) | 23,118.60 | -1.19% |
| Straits Times (Singapore) | 5,638.64 | -1.39% |
Carried from our Asia Market Wrap of Tuesday 15 September 2026: no index on the Asia board rose, so the 10 rows are its losers, ranked. The Nifty 50 is measured against its 11 September close because Indian markets were shut on Monday for a public holiday.
Middle East, session of Tuesday 15 September 2026
| Index | Close | Change |
|---|---|---|
| EGX 30 (Egypt) | 54,909.17 | +0.21% |
| ASE Index (Jordan) | 4,106.16 | +0.18% |
| FTSE ADX General (Abu Dhabi) | 10,135.93 | +0.17% |
| Bahrain All Share (Bahrain) | 1,929.36 | -0.04% |
| Kuwait All Share (Kuwait) | 8,945.99 | -0.18% |
| MSX 30 (Oman) | 7,614.87 | -0.20% |
| QE Index (Qatar) | 9,773.75 | -0.51% |
| DFM General (Dubai) | 5,927.38 | -0.82% |
| Tadawul All Share (Saudi Arabia) | 10,781.62 | -0.89% |
Carried from our Middle East Market Wrap of Tuesday 15 September 2026, gainers then losers. The DFM change is the exchange’s own daily figure, and the QE Index change is our calculation against our published 14 September close.
Europe, session of Tuesday 15 September 2026
| Index | Close | Change |
|---|---|---|
| IBEX 35 (Spain) | 19,555.90 | -0.05% |
| FTSE MIB (Italy) | 51,555.19 | -0.14% |
| DAX (Germany), Xetra close | 25,402.28 | -0.15% |
| AEX (Netherlands) | 1,095.87 | -0.23% |
| Stoxx Europe 600 (Europe) | 634.18 | -0.28% |
| CAC 40 (France) | 8,090.28 | -0.34% |
| FTSE 100 (United Kingdom) | 10,658.13 | -0.37% |
| Euro Stoxx 50 (euro area) | 6,236.50 | -0.38% |
| SMI (Switzerland) | 13,808.87 | -0.50% |
Carried from our Europe Market Wrap of Tuesday 15 September 2026: no index on the Europe board rose, so the 9 rows are its losers, ranked; each close was from its own exchange or index administrator, and the 14 September comparison bases include the amendments noted on our 14 September wrap. Amended 16 September 2026: the Stoxx Europe 600 row to 634.18 (change 0.28 percent lower) and the Euro Stoxx 50 row to 6,236.50 (change 0.38 percent lower), matching the amendment on our Europe wrap of 15 September, with the rows re-ranked accordingly.
Why it matters: the repricing is running through the discount rate, not through earnings, on our reading: with the 10 year at levels the network calls its highest since 2007, the only sectors bid were the 2 tied to hard assets, the main dividend proxy made a new low, and crypto sold alongside equities rather than against them, which is a positioning story, not an inflation hedge story. Wednesday’s decision now lands on a market that has already moved to meet it, having fallen 6 times in 7 sessions. Across everything we published on 15 September, the EGX 30 is the day’s best index of the 33 at 0.21 percent higher and Singapore’s Straits Times the worst at 1.39 percent lower.
Outlook: the Federal Reserve decides on Wednesday, with a quarter point rise widely expected per market pricing and the network’s reporting, and the question the session leaves is whether the 10 year holds 5 percent once the decision is in. For the sector board, the East West pipeline repair window, from days on the US energy secretary’s estimate to 8 weeks at the far end of the Goldman Sachs range our commodities wrap carries, sets how long the energy bid lasts. Wells Fargo’s warning of 5 to 10 percent downside risk frames the risk case, with its reduced 7,700 year end target sitting just above Tuesday’s close; the utilities fund at a 52 week low is the live test of the rate.
Sources: CNBC, US Department of the Treasury, The Edge.