Middle East Market Wrap 21 September: Abu Dhabi Leads the Fallers and Egypt’s Pound Firms Below 52

7 of the 9 indices on our Middle East board fell on Monday: Abu Dhabi’s FTSE ADX General lost 1.61 percent on the exchange’s own figures, the board’s largest move by nearly a full percentage point. Qatar’s QE Index led the 2 gainers at 0.09 percent higher, on our calculation, and Dubai’s DFM General added 0.05 percent on its exchange’s daily figure. Egypt’s pound moved the other way from its board: the Central Bank of Egypt’s official dollar rate firmed to below 52 on both sides, at 51.8636 to buy, from a sell side above 52 on Sunday, while the EGX 30 fell 0.68 percent. Brent crude traded at 101.07 dollars a barrel at our 12:19 GMT capture, down 2.70 percent from Friday’s settlement.
Abu Dhabi falls hardest as the Gulf trades against sliding oil
The fall was concentrated in Abu Dhabi: the FTSE ADX General dropped 165.69 points, or 1.61 percent, to 10,106.07 on the exchange’s own figures, with the FTSE ADX 15 down 1.40 percent, on 843.5 million dirhams of value across 21,138 trades. The rest of the Gulf fell by less: the Tadawul All Share lost 0.63 percent to 10,681.82, Bahrain’s All Share 0.42 percent to 1,911.97 and Oman’s MSX 30 0.39 percent to 7,550.45, with 22 decliners against 15 advancers on the exchange’s count, while Kuwait’s All Share closed 0.02 percent lower at 8,846.45, all but flat, on 89.4 million dinars of value across 22,042 trades, with its Premier Market Index 0.01 percent higher. Dubai’s DFM General rose 0.05 percent to 5,960.24 on the exchange’s own daily closing table and Qatar’s QE Index added 0.09 percent to 9,559.05, on our calculation against our published Sunday close. The session traded against a falling oil column: Brent stood 2.70 percent below Friday’s settlement at our capture even after Iran backed Houthi missile and drone attacks on Saudi Arabia on Saturday, with JPMorgan analysts putting Middle East oil flows at an average of 17.1 million barrels a day over the past 10 days in a note the network cited, per its oil report.
Cairo’s board slips as the pound firms below 52
Egypt’s EGX 30 fell 0.68 percent to 54,994.31 on the exchange’s own figure, from Sunday’s 55,371.47 close, while the official rate strengthened: the Central Bank of Egypt’s dollar/pound exchange rate read 51.8636 to buy and 51.9985 to sell for 21 September, from 51.9520 and 52.0911 on Sunday, moves of 0.17 and 0.18 percent on our calculation that take the official rate below 52 to the dollar on both sides, from a sell side above 52 on Sunday. Amman’s ASE Index fell 0.40 percent to 4,098.86, on our calculation against our published closes. The Central Bank of Kuwait’s dollar/dinar reference rate read 0.30730/40 for 21 September with a value date of 23 September, matching its Thursday 17 September fixing in our published record. Both fixings print in the official rates table below. Across everything we published today, the day’s best is South Korea’s Kospi at 1.65 percent higher and the worst Abu Dhabi’s FTSE ADX General at 1.61 percent lower, on our count.
Top gainers
| Index | Close | Change |
|---|---|---|
| QE Index (Qatar) | 9,559.05 | +0.09% |
| DFM General (Dubai) | 5,960.24 | +0.05% |
Top gainers, closes of Monday 21 September 2026 from the exchanges, ranked by change. The DFM change is the exchange’s own daily figure, standing against its Friday 18 September close since the market trades Monday to Friday; the QE Index level is the exchange ticker’s and its change is our calculation against our published 20 September close; both read from the exchanges between 12:36 and 12:41 GMT.
Top losers
| Index | Close | Change |
|---|---|---|
| Kuwait All Share (Kuwait) | 8,846.45 | -0.02% |
| MSX 30 (Oman) | 7,550.45 | -0.39% |
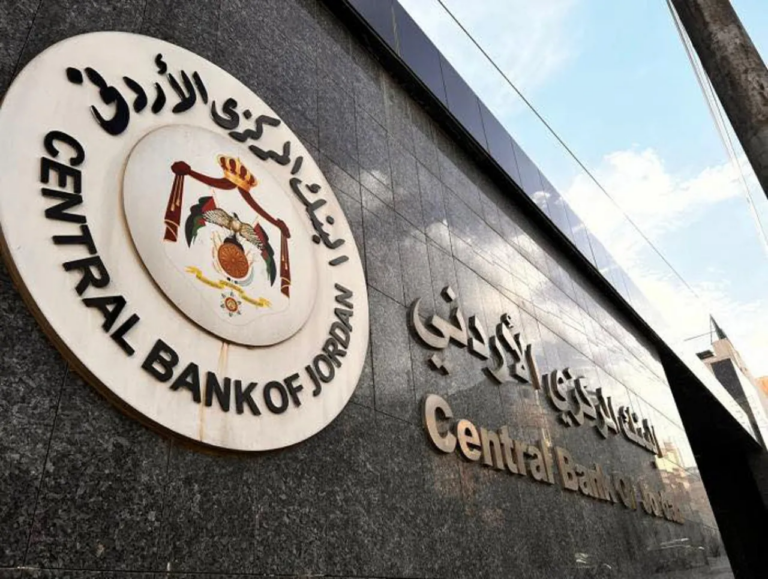
| ASE Index (Jordan) | 4,098.86 | -0.40% |
| Bahrain All Share (Bahrain) | 1,911.97 | -0.42% |
| Tadawul All Share (Saudi Arabia) | 10,681.82 | -0.63% |
| EGX 30 (Egypt) | 54,994.31 | -0.68% |
| FTSE ADX General (Abu Dhabi) | 10,106.07 | -1.61% |
Top losers, same session, ranked by change; the Kuwait, Muscat, Bahrain, Saudi and Cairo changes are the exchanges’ own, each reconciling against our published 20 September closes, the Amman percentage is our calculation against those closes, and the Abu Dhabi change is the exchange’s own, standing against its Friday 18 September close since the market trades Monday to Friday. The Saudi rows were taken after the closing auction, two stable reads. Omitted rows: Premier Market (Kuwait) 9,183.34, plus 0.01 percent; Main Market (Kuwait) 9,420.82, minus 0.16 percent; BK Main 50 (Kuwait) 11,255.90, minus 0.48 percent; MSCI Tadawul 30 (Saudi Arabia) 1,435.69, minus 0.55 percent; Nomu Parallel Market (Saudi Arabia) 21,472.54, minus 0.19 percent; FTSE ADX 15 (Abu Dhabi) 10,686.62, minus 1.40 percent. All levels read from the exchanges between 12:23 and 12:56 GMT.
Commodities and currencies
| Instrument | Level | Change |
|---|---|---|
| Gold, COMEX (Dec’26), dollars an ounce | $4,407.80 | -0.39% |
| Silver, COMEX (Dec’26), dollars an ounce | $67.17 | +0.03% |
| Brent Crude, ICE (Nov’26), dollars a barrel | $101.07 | -2.70% |
| WTI Crude, NYMEX (Oct’26), dollars a barrel | $97.30 | -2.99% |
| US Dollar Index (DXY) | 100.229 | +0.01% |
| Euro/Dollar | 1.1488 | +0.04% |
| Sterling/Dollar | 1.3395 | +0.01% |
| Dollar/Yen | 157.24 | +0.24% |
Intraday quotes captured at 12:19 GMT on Monday 21 September 2026, one call, one stamp, fixed order; the gold, silver, Brent and WTI changes are measured against Friday’s settlements as carried in the price feed, settlement to snapshot, and the currency rows are on the vendor’s daily basis.
Official reference rates
| Rate | Level | Date |
|---|---|---|
| CBK dollar/dinar official reference rate | 0.30730/40 | 21 September 2026, value date 23 September 2026 |
| CBE dollar/Egyptian pound, buy/sell | 51.8636 / 51.9985 | 21 September 2026 |
Dated official fixings from the central banks’ own pages; the CBK level is the official dollar/dinar reference rate with its standard T plus 2 value date, and the CBE level is its official exchange rate series, buy and sell; read at 12:54 and 12:46 GMT on 21 September 2026.
Asia reference
| Index | Close | Change |
|---|---|---|
| Kospi (South Korea) | 7,007.72 | +1.65% |
| Hang Seng (Hong Kong) | 25,042.71 | +1.18% |
| Taiex (Taiwan) | 47,718.84 | +1.14% |
| Shanghai Composite (China) | 3,949.91 | +0.97% |
| Shenzhen Component (China) | 13,730.02 | +0.65% |
| Straits Times (Singapore) | 5,675.23 | +0.34% |
| Nifty 50 (India) | 23,414.30 | +0.29% |
| S&P/ASX 200 (Australia) | 8,731.90 | +0.01% |
Carried whole from our Asia Market Wrap of 21 September 2026, closes of Monday 21 September on the basis published there; no index that traded fell, and Japanese markets were closed for a public holiday, so the Nikkei 225 and Topix carry no session.
Why it matters: the Gulf split from Asia’s rally on Monday, on our reading: the region that earns the oil revenue traded lower while the region that imports the barrels rose, and the same 2.70 percent Brent slide sits on both sides of that ledger, easing the imported costs Asia’s boards discount while pressing the revenue line the Gulf’s boards price. Abu Dhabi’s 1.61 percent fall, the board’s largest move by nearly a full percentage point, did most of the day’s damage, on our reading, and Cairo’s session paired a falling board with a firming official rate, below 52 to the dollar on both sides, from a sell side above 52 on Sunday.
Outlook: our Europe wrap follows this evening with the Stoxx boards trading the same oil slide, and the US wrap after the New York close. For this board the test is whether Abu Dhabi’s fall extends or retraces with Brent near 100 dollars a barrel.
Sources: Boursa Kuwait, Muscat Stock Exchange, Bahrain Bourse, Qatar Stock Exchange, Abu Dhabi Securities Exchange, Dubai Financial Market, Amman Stock Exchange, The Egyptian Exchange, Saudi Exchange, Central Bank of Kuwait, Central Bank of Egypt, CNBC, The Edge.