China’s Services Trade Grows 8.5% to 5.77 Trillion Yuan in Nine Months, Exports Up 14.8%
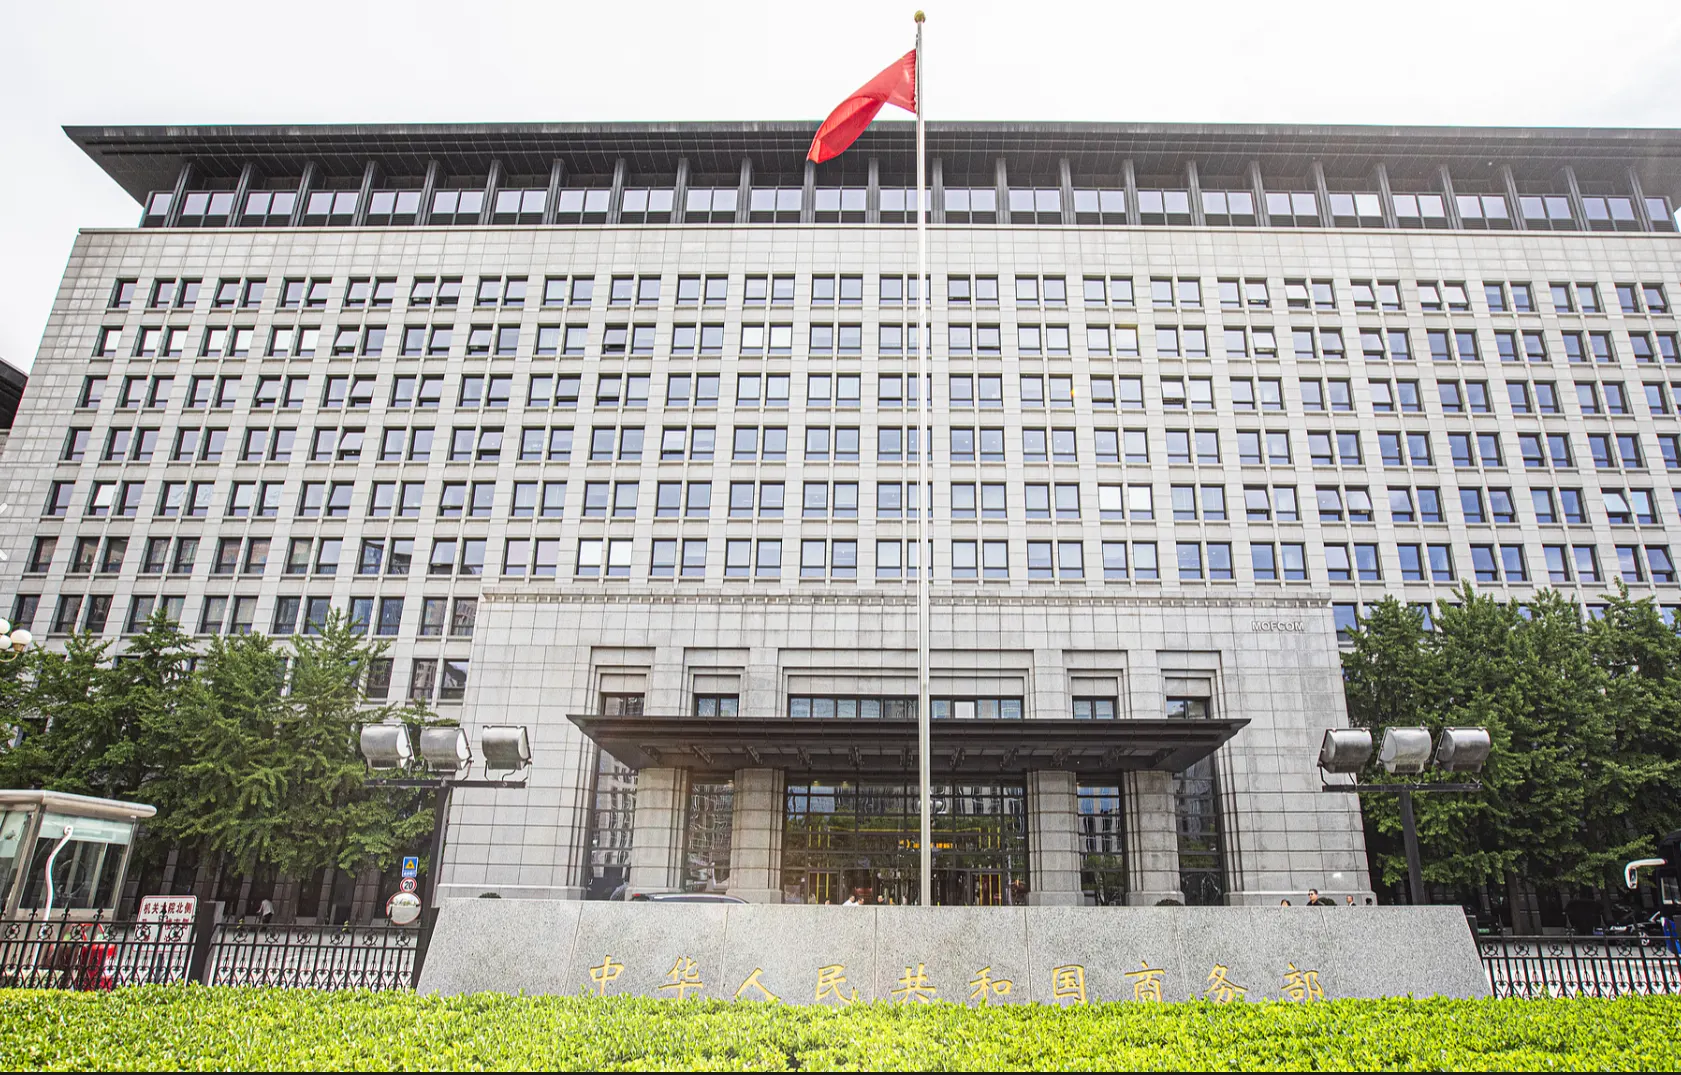
China’s trade in services grew 8.5% to 5.77 trillion yuan ($858.7 billion) in the first nine months of 2026, the Ministry of Commerce said, as exports outpaced imports.
For China’s service exporters the gain is real: sales abroad rose 14.8%, against 4.8% for purchases from abroad, and the services deficit narrowed. In The Edge’s reading, though, the improvement peaked at the end of July: the year-on-year narrowing has shrunk in each month since, and September’s deficit was wider than a year earlier.
Exports reached 2.27 trillion yuan ($338.1 billion) and imports 3.50 trillion yuan ($520.6 billion). That left a deficit of 1.23 trillion yuan ($182.5 billion), 132.66 billion yuan smaller than in the same period of 2025.
Services trade, January to September 2026 (value in billions of yuan)
| Measure | Value | On year |
|---|---|---|
| Total trade | 5,768.77 | 8.5% |
| Exports | 2,271.40 | 14.8% |
| Imports | 3,497.37 | 4.8% |
| Deficit | 1,225.97 | 132.66 smaller |
| Transport | 1,281.72 | 33.9% |
| Knowledge-intensive | 2,532.17 | 7.4% |
Growth is the ministry’s own year-on-year comparison; the deficit row shows the change in billions of yuan.
Export growth beats import growth in every release this year
Export growth has outpaced import growth in all eight cumulative releases the ministry has published for 2026. Export growth peaked at midyear, at 17.6% for the first half, when imports were up 2.9%.
Since then the two have converged. Export growth slowed to 14.8% by the end of August and stayed there in September. Import growth has picked up in every release of the year, from a fall of 8.7% in January and February.
Total growth of 8.5% is the fastest year-to-date pace of the eight releases, up from 7.9% at the end of August. The year began with a 3.9% decline in January and February.
Exports covered 64.9% of imports over the nine months. That is up from 63.0% in the first quarter but below the 66.3% reached at the end of July, the high point of the year.
Year-to-date growth in services trade, 2026 (in %)
| Period | Total | Export | Import |
|---|---|---|---|
| Jan to Feb | -3.9 | 4.7 | -8.7 |
| Jan to Mar | 2.3 | 11.2 | -2.6 |
| Jan to Apr | 4.9 | 15.0 | -0.8 |
| Jan to May | 6.0 | 15.9 | 0.4 |
| Jan to Jun | 8.3 | 17.6 | 2.9 |
| Jan to Jul | 8.3 | 17.1 | 3.2 |
| Jan to Aug | 7.9 | 14.8 | 3.8 |
| Jan to Sep | 8.5 | 14.8 | 4.8 |
Cumulative year-on-year growth as printed in each monthly statement.
The levels rest on a new statistical method. From the January to February data, the ministry compiles services trade under a revised International Trade in Services Statistical Monitoring System, issued in January with the National Bureau of Statistics and the State Administration of Foreign Exchange.
The revision changes the treatment of seven areas, among them transport, other business services, financial services and telecommunications, computer and information services. The 2026 levels therefore do not line up with the ministry’s figures for 2025: its release for the first three quarters of last year put total services trade at 5.94 trillion yuan.
Transport grows fastest of any sector
Transport trade rose 33.9% to 1.28 trillion yuan ($190.8 billion), the fastest growth of any sector, the ministry said. By size it ranks third, behind travel and other business services.
Both directions grew strongly. Transport exports rose 29.4% to 482.32 billion yuan. Imports rose faster, by 36.8% to 799.40 billion yuan.
That left a transport deficit of 317.08 billion yuan, 25.9% of the whole services deficit. Transport made up 22.2% of total services trade over the nine months.
Import growth in transport has quickened through the year. It was 22.8% in the first quarter and 30.4% in the first half. On The Edge’s calculation from the cumulative totals, transport imports for July to September alone came to 301.30 billion yuan, against 498.10 billion for the whole first half.
Export growth in transport has edged up as well, from 27.1% at the end of July to 29.4% now.
Knowledge-intensive services supply more than half of exports
Knowledge-intensive services, which the ministry tracks as a group, totalled 2.53 trillion yuan ($376.9 billion), up 7.4%. They made up 43.9% of all services trade.
Their exports rose 11.7% to 1.22 trillion yuan. That is 53.7% of services exports. Within the group, exports of personal, cultural and recreational services grew fastest, by 69.1%, followed by insurance and pension services at 50.3%.
Imports of these services rose 3.7% to 1.31 trillion yuan. They accounted for 37.5% of services imports. Imports exceeded exports by 92.37 billion yuan, a gap equal to 7.5% of the overall services deficit.
The group’s growth has recovered from a 3.2% decline in January and February to 7.4%, its fastest pace of the year. Their share of services exports has stayed between 53.5% and 53.7% in the four releases since midyear, below the 56.1% of January and February.
The deficit’s narrowing fades after July
The year-on-year improvement in the deficit peaked at 176.33 billion yuan at the end of July. It then shrank to 145.12 billion by August and 132.66 billion by September.
Subtracting the cumulative totals, September’s deficit alone was 155.03 billion yuan, on The Edge’s calculation. The ministry’s year-on-year narrowing shrank by 12.46 billion yuan between the August and September releases, so the month’s deficit was wider than in September 2025.
The month’s exports were 271.79 billion yuan and imports 426.82 billion yuan. The official balance of payments figures for September, published on 30 October, put the services deficit at 155.0 billion yuan, or $22.9 billion, as set out that day.
Year-to-date deficit and its narrowing, 2026 (in billions of yuan)
| Period | Deficit | Narrowing |
|---|---|---|
| Jan to Feb | 258.10 | 86.52 |
| Jan to Mar | 413.86 | 100.15 |
| Jan to Apr | 515.32 | 139.74 |
| Jan to May | 638.56 | 160.72 |
| Jan to Jun | 770.35 | 161.42 |
| Jan to Jul | 900.25 | 176.33 |
| Jan to Aug | 1,070.94 | 145.12 |
| Jan to Sep | 1,225.97 | 132.66 |
Narrowing is the reduction in the deficit against the same period of 2025, as printed.
The same arithmetic splits the year into quarters. The third quarter’s deficit, 455.62 billion yuan, was the largest of the three. The first quarter’s was 413.86 billion and the second’s 356.49 billion.
The year-on-year narrowing shrank by 28.76 billion yuan between the first-half and nine-month releases, so the third quarter gave back part of the year’s improvement. Third-quarter exports, at 766.70 billion yuan, were below the second quarter’s 800.18 billion.
Services trade by quarter, 2026 (in billions of yuan)
| Period | Export | Import | Net |
|---|---|---|---|
| Q1 | 704.5 | 1,118.4 | -413.9 |
| Q2 | 800.2 | 1,156.7 | -356.5 |
| Q3 | 766.7 | 1,222.3 | -455.6 |
| Sep | 271.8 | 426.8 | -155.0 |
Q1 as printed; Q2, Q3 and September are the differences between cumulative totals. Net is exports minus imports.
What to watch: The ninth China International Import Expo runs in Shanghai from 5 to 10 November, the ministry said on 3 November.
Figures are from the Ministry of Commerce of the People’s Republic of China’s statements on services trade for 2026, the latest dated 4 November 2026, and its statement for the first three quarters of 2025 dated 4 November 2025, and from the State Administration of Foreign Exchange’s September release of 30 October 2026. Quarterly and monthly figures are derived from cumulative totals; percentages and comparisons not attributed to a source are The Edge’s calculations. Dollar equivalents at the People’s Bank of China central parity of 4 November 2026 (6.7180 yuan per dollar), on The Edge’s calculation.
Sources: Ministry of Commerce of the People’s Republic of China, People’s Bank of China, State Administration of Foreign Exchange, The Edge.