US Market Wrap 9 September: Dow Falls 405 Points as Oil Tops 100 Dollars and Yields Rise
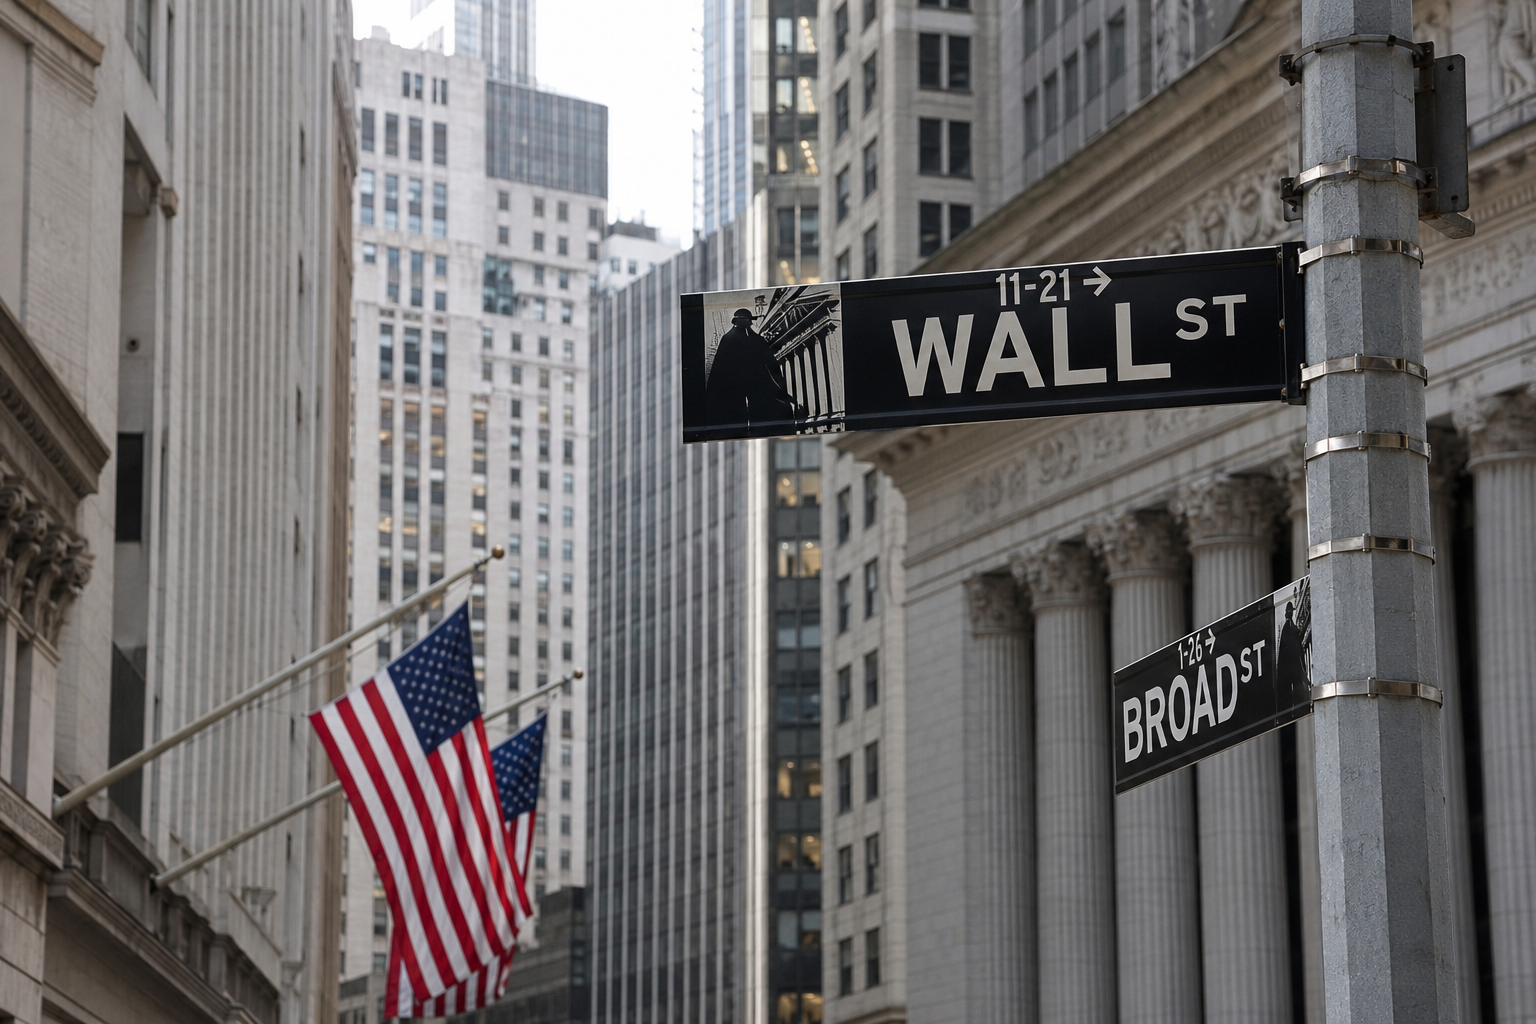
Wall Street fell across the board on Wednesday as crude oil above 100 dollars a barrel and a higher Treasury curve weighed on equities, with 10 of the 11 S&P 500 sectors lower and only energy rising. The Dow Jones Industrial Average fell 405.41 points, or 0.77 percent, to 52,380.66, the S&P 500 lost 0.48 percent to 7,636.36 and the Nasdaq Composite 0.64 percent to 26,253.34, while the small cap Russell 2000 was the weakest major, down 1.32 percent. The technology heavy Nasdaq 100 held up best, down 0.29 percent, and energy was the only sector to rise, up 1.09 percent, as Brent traded above 101 dollars a barrel after the escalation in the Persian Gulf, per CNBC.
Small caps led a broad decline
The decline was broad. The small cap Russell 2000 dropped 1.32 percent, a full 1.03 percentage points more than the Nasdaq 100’s 0.29 percent slip and more than four times as deep, on our calculation, and among the sectors the steepest falls were in industrials, down 1.51 percent, consumer discretionary, down 1.39 percent, utilities, down 1.17 percent, and real estate, down 1.12 percent. The Dow’s 405.41 point fall follows Tuesday’s 628.18 point drop, leaving the average down 1,033.59 points over the two sessions from its 4 September close, on our calculation. Financials eased 0.43 percent and health care 0.37 percent, while information technology fell only 0.16 percent, the shallowest decline among the fallers and consistent with the Nasdaq 100’s relative resilience.
Only energy rose as oil held above 100 dollars
Energy was the single gainer among the 11 S&P 500 sectors, up 1.09 percent, as crude held above 100 dollars a barrel, while the other 10 fell. The board ran a spread of 2.60 percentage points, from energy’s 1.09 percent gain to industrials’ 1.51 percent decline, on our calculation, and the breadth pointed to a macro driven session rather than an isolated company story, energy alone advancing with crude while higher yields coincided with weakness across the rest of the board. The oil story featured across every session we cover on Wednesday, and the other regional boards are carried below for reference, abridged and verbatim from our own wraps of 9 September.
The curve rose across maturities
The Treasury’s official par curve for 9 September rose along its length. The 2 year yield rose 4 basis points from Tuesday to 4.43 percent, the 3 year 5 basis points to 4.49, the 5 year 4 basis points to 4.61, the 10 year 3 basis points to 4.83 and the 30 year 3 basis points to 5.28, on our comparison of the Treasury’s 9 and 8 September rows. Over the two sessions since the 4 September close the curve has risen 6 basis points at the 2 year, 7 at the 5 year, 5 at the 10 year and 4 at the 30 year, on our calculation, so Wednesday extended a move already under way. The 1 year rose 2 basis points to 4.17 percent and the 7 year 3 basis points to 4.71, while the 1 month Treasury yield was unchanged at 3.81 percent.
Oil, gold, the dollar and volatility
Brent for November traded at 101.67 dollars a barrel at the 20:23 GMT capture and West Texas Intermediate for October at 96.83 dollars, up 3.83 percent and 4.08 percent respectively against Tuesday’s settlement, our post close snapshots sitting just above the official ICE and NYMEX settlements of 101.21 and 96.05 dollars, up 3.4 and 3.3 percent, carried in our commodities wrap of 9 September. Gold for December was little changed at up 0.10 percent to 4,443.60 dollars. The dollar index was flat at up 0.05 percent to 98.835, and bitcoin eased 0.21 percent to 78,235 dollars on the vendor’s daily basis. The Cboe Volatility Index rose 4.71 percent to 16.46, its second consecutive rise, and is up 13.28 percent over the two sessions from the 14.53 close in our published 4 September wrap, on our calculation.
| Index | Close | Change |
|---|---|---|
| Nasdaq 100 | 29,421.55 | -0.29% |
| S&P 500 | 7,636.36 | -0.48% |
| Nasdaq Composite | 26,253.34 | -0.64% |
| Dow Jones Industrial Average | 52,380.66 | -0.77% |
| Russell 2000 | 2,921.24 | -1.32% |
Closes for Wednesday 9 September 2026, ranked by change, captured at 20:23 GMT after the 20:00 GMT cash close and confirmed frozen against the 20:00 GMT pull; the Russell 2000 is unchanged on a 20:23:47 GMT repeat read. Every change reconciles against our own published closes of 8 September.
| S&P 500 sector | Change |
|---|---|
| Energy | +1.09% |
| Information Technology | -0.16% |
| Communication Services | -0.24% |
| Health Care | -0.37% |
| Financials | -0.43% |
| Materials | -0.85% |
| Consumer Staples | -0.94% |
| Real Estate | -1.12% |
| Utilities | -1.17% |
| Consumer Discretionary | -1.39% |
| Industrials | -1.51% |
The 11 S&P 500 sectors ranked continuously, gainer then decliners, from the 20:23 GMT capture. 1 rose and 10 fell.
| Maturity | 9 Sep | 8 Sep | Change |
|---|---|---|---|
| 2 year | 4.43% | 4.39% | +4bp |
| 3 year | 4.49% | 4.44% | +5bp |
| 5 year | 4.61% | 4.57% | +4bp |
| 10 year | 4.83% | 4.80% | +3bp |
| 30 year | 5.28% | 5.25% | +3bp |
The US Department of the Treasury’s official daily par yield curve for 9 and 8 September 2026, key maturities, from indicative bid side quotations at or near 19:30 GMT in US summer time; the changes are our calculation. The 1 year rose 2 basis points to 4.17 percent, the 7 year 3 basis points to 4.71 percent and the 20 year 2 basis points to 5.28 percent, while the 1 month Treasury yield was unchanged at 3.81 percent.
| Instrument | Level | Change |
|---|---|---|
| CBOE Volatility Index | 16.46 | +4.71% |
| US Dollar Index (DXY) | 98.835 | +0.05% |
| Bitcoin, dollars | 78,235 | -0.21% |
Intraday quotes at the 20:23 GMT capture; these are snapshot levels of continuously computed instruments, not equity closes. The VIX change is against our published 8 September close of 15.72; the dollar index and bitcoin are on the vendor’s daily prior close.
Asia, for reference
| Index | Close | Change |
|---|---|---|
| Kospi (South Korea) | 7,051.64 | +1.40% |
| Shanghai Composite (China) | 3,951.51 | +0.28% |
| Hang Seng (Hong Kong) | 25,274.96 | -0.17% |
| Nikkei 225 (Japan) | 65,142.78 | -0.19% |
| Nifty 50 (India) | 23,431.50 | -0.86% |
Selected closes for Wednesday 9 September 2026, ranked by change, carried verbatim from our Asia Market Wrap of 9 September; Asian markets were mixed and the full 10 index board is in that wrap.
Europe, for reference
| Index | Close | Change |
|---|---|---|
| FTSE 100 (UK) | 10,670.06 | -1.31% |
| Stoxx Europe 600 (Europe) | 640.41 | -1.41% |
| DAX (Germany) | 25,576.45 | -1.66% |
| CAC 40 (France) | 8,156.67 | -1.94% |
Selected closes for Wednesday 9 September 2026, ranked by change, carried verbatim from our Europe Market Wrap of 9 September, where every one of the 11 benchmarks fell; the full board is in that wrap.
Middle East, for reference
| Index | Close | Change |
|---|---|---|
| FTSE ADX General (Abu Dhabi) | 10,106.60 | +0.85% |
| EGX 30 (Egypt) | 56,500.74 | +0.58% |
| Main Market (Kuwait) | 9,281.64 | +0.27% |
| Tadawul All Share (Saudi Arabia) | 11,015.72 | -0.19% |
| DFM General (Dubai) | 5,927.40 | -0.32% |
Selected closes for Wednesday 9 September 2026, ranked by change, carried verbatim from our Middle East Market Wrap of 9 September; Gulf and Egyptian markets were mixed and the full 12 index board is in that wrap.
Commodities, for reference
| Contract | Settlement | Change |
|---|---|---|
| Brent Crude, ICE (Nov’26), dollars a barrel | 101.21 | +3.4% |
| WTI Crude, NYMEX (Oct’26), dollars a barrel | 96.05 | +3.3% |
Crude settlements for 9 September, carried from our Commodities Wrap of 9 September; the full four board commodities table, including metals, agriculture and the rates and currencies board, is in that wrap.
Why it matters: The session was a rates and oil story rather than a stock specific one, on our reading. The decline was broad, led by the small cap Russell 2000 and by the industrial, consumer discretionary, utility and real estate sectors, while energy alone rose with crude above 100 dollars and the technology heavy Nasdaq 100 fell least. The Treasury curve rose across its length for a second session, up as much as 7 basis points at the 5 year over the two sessions, and that combination, higher yields with oil at its highest settlement since 22 May, per CNBC, points to the market weighing the inflation risk ahead rather than any single company’s news.
Outlook: The producer price index for August lands on Thursday 10 September and the consumer price index for August on Friday 11 September, per our published wraps, the final headline inflation readings before the Federal Reserve’s 15 and 16 September meeting. Because both cover August, Wednesday’s oil move does not feed the energy component of either, on our reading; its weight is on September inflation and on longer term expectations. The European Central Bank decides on Thursday. With the curve higher, energy the only sector to rise and small caps leading the fall, investors enter the releases with the yield move already visible across the market, and a firm August reading, or a sustained oil premium into September, would add to the upward pressure on yields that shaped Wednesday’s session.
Sources: CNBC, US Department of the Treasury, The Edge.