Egypt’s Urban Inflation Eases to 13.9 Percent, Its Biggest Step Down Since August 2025
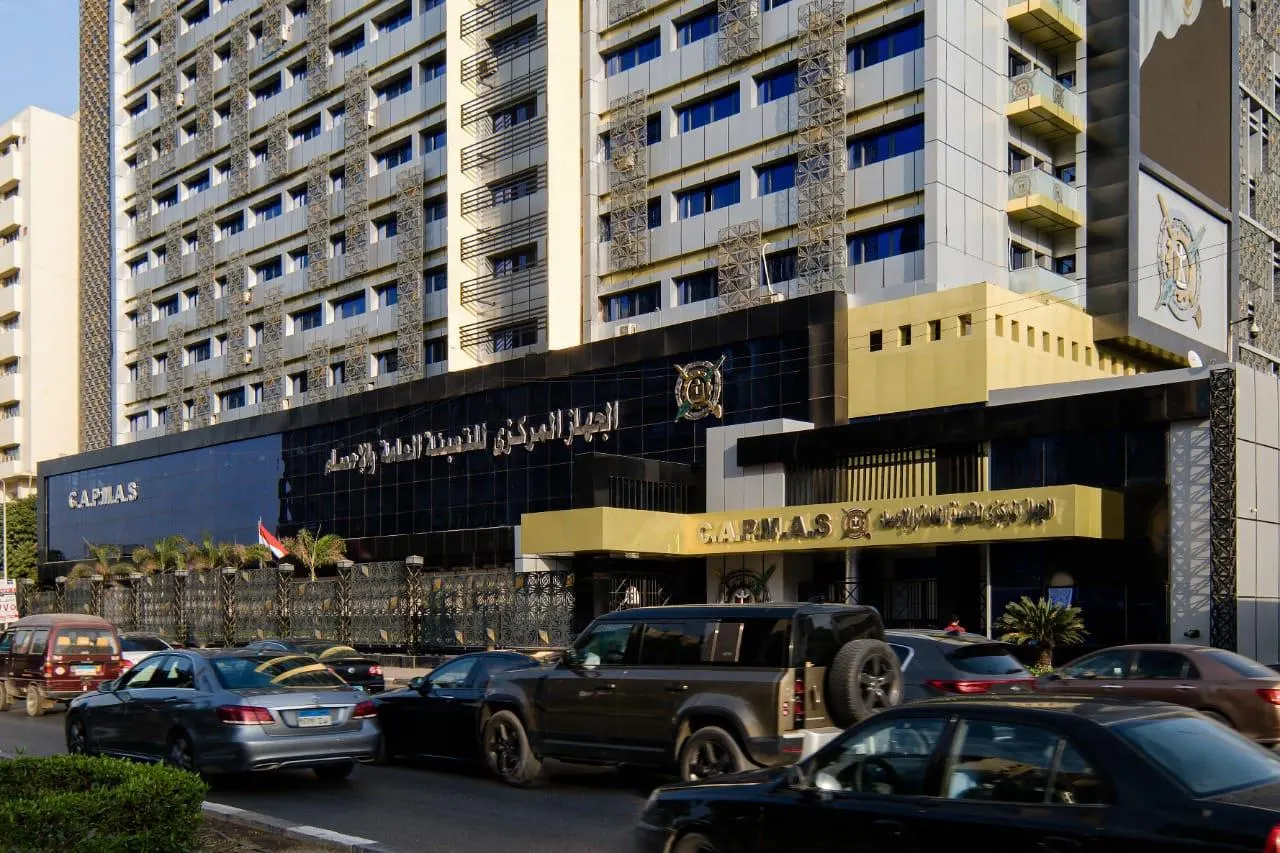
Annual consumer price inflation in Egypt’s cities eased to 13.9 percent in September from 14.5 percent in August, according to the urban series of the Central Agency for Public Mobilization and Statistics (CAPMAS). It was the second straight monthly slowdown, after 14.9 percent in July, and the 0.6 percentage point step down was the largest one-month improvement in the urban rate since August 2025, on our calculation. September’s figure is the first below 14 percent since February, on our reading.
Urban Rate Has Eased in 5 of the 6 Months Since March
The urban rate reached its high for the year at 15.2 percent in March. On our calculation, it has come down in 5 of the 6 months since then, with July the only exception, now stands 1.3 points below that high, and has shed 1.0 point in the last 2 months of easing, a pace of 0.50 points a month.
On our calculation, the third quarter’s urban average of 14.4 percent marked the first quarterly decline of the year, and September’s 13.9 percent sits 0.3 points below the 9-month average of 14.2 percent.
Prices were steady over the summer. In its statement of 24 September, the Central Bank of Egypt put monthly headline inflation at minus 0.4 percent in June, 0.0 percent in July and 0.1 percent in August. Compounded, those 3 months left headline prices in August 0.3 percent lower than in May, on our calculation.
Urban Inflation Eased to 13.9 Percent as the Gap With Rural Areas Closed to 2.3 Points
| Month | Urban | Rural | Gap (pts) |
|---|---|---|---|
| Jan 2026 | 11.9% | 8.4% | 3.5 |
| Feb 2026 | 13.4% | 9.7% | 3.7 |
| Mar 2026 | 15.2% | 11.9% | 3.3 |
| Apr 2026 | 14.9% | 12.0% | 2.9 |
| May 2026 | 14.6% | 11.4% | 3.2 |
| Jun 2026 | 14.3% | 10.1% | 4.2 |
| Jul 2026 | 14.9% | 11.2% | 3.7 |
| Aug 2026 | 14.5% | 10.9% | 3.6 |
| Sep 2026 | 13.9% | 11.6% | 2.3 |
Annual rates from the statistics agency’s urban and rural series on a 2018/2019 base; the gap in percentage points is our calculation.
Cities and Countryside Move Closer Together
The gap between urban and rural inflation shrank to 2.3 points in September from 3.6 points in August, the smallest since August 2025, on our calculation. The gap closed from both ends: the urban rate eased by 0.6 points, while rural inflation rose to 11.6 percent from 10.9 percent. On our reading of the series, the urban rate has still run above the rural rate in every month since March 2024.
On our reading, the rural rise is also why the national rate edged up to 12.8 percent from 12.7 percent while the urban rate came down. Urban inflation now runs 1.1 points above the national figure, against 1.8 points in August, the smallest margin since August 2025, on our calculation. The national figure and its 12 spending groups were covered in our report of 10 October.
CAPMAS sets each item’s weight at the urban and rural level of the governorates, from the 2017/2018 household income, expenditure and consumption survey, so the two series are weighted separately.
Over a longer span, urban inflation in September was 2.2 points higher than the 11.7 percent of September 2025. Most of this year’s upward movement came in February and March, when the rate climbed to 15.2 percent from 11.9 percent in January; July’s 0.6 point rise was the only other monthly increase in 2026, on our calculation.
Urban Inflation Averaged 14.4 Percent in the Third Quarter, Down From the Second
| Quarter | Urban | Rural | Gap (pts) |
|---|---|---|---|
| Q1 2026 | 13.5% | 10.0% | 3.5 |
| Q2 2026 | 14.6% | 11.2% | 3.4 |
| Q3 2026 | 14.4% | 11.2% | 3.2 |
Averages of the published monthly annual rates for each quarter; the gap is urban minus rural, our calculation.
Deposit Rate Margin Over Urban Inflation Widens to 5.1 Points
The overnight deposit rate has been 19.00 percent since 15 February, and the bank’s rate-setting committee left it unchanged on 24 September. On our calculation, its margin over the urban rate has widened to 5.1 points from 4.5 points in August, the widest in any full month since that rate took effect. Deflated by the urban rate on a compounded basis, the deposit rate gives a real return of 4.5 percent, an after-the-fact measure against past inflation rather than a forward-looking real rate.
Urban Inflation Against the 19.00 Percent Deposit Rate Since March
| Month | Urban inflation | Margin to 19.00% deposit rate (pts) |
|---|---|---|
| Mar 2026 | 15.2% | 3.8 |
| Apr 2026 | 14.9% | 4.1 |
| May 2026 | 14.6% | 4.4 |
| Jun 2026 | 14.3% | 4.7 |
| Jul 2026 | 14.9% | 4.1 |
| Aug 2026 | 14.5% | 4.5 |
| Sep 2026 | 13.9% | 5.1 |
Urban annual inflation from the statistics agency’s series; the margin is the overnight deposit rate minus urban inflation, our calculation.
For scale, the urban rate is 4.9 points above 9 percent, the top of the central bank’s target of 7 percent, plus or minus 2 points, and 6.9 points above the 7 percent midpoint, on our calculation. The committee expects headline inflation to approach that target during the second half of 2027 and still sees the risks tilted to the upside, through fiscal consolidation measures and international food prices. Reaching 9 percent by July 2027 would take an average decline of 0.49 points a month, and by December 2027, 0.33 points a month; that is arithmetic on the published figures, not a forecast. The urban rate’s pace over the last 2 months, 0.50 points a month, exceeds both. Since March, the urban rate has covered 1.3 of the 6.2 points between its 2026 high and the top of the band, or 21 percent of the distance, on our calculation.
Why it matters: With the overnight deposit rate unchanged at 19.00 percent since February, each step down in urban inflation lifts the real return on that rate: on a compounded basis it has risen to 4.5 percent from 3.9 percent in August, on our calculation. The urban rate also now sits closer to the rural and national readings than at any time since August 2025.
Outlook: The Monetary Policy Committee meets on 29 October and again on 17 December. The bank’s own September headline and core figures, once posted, will show whether underlying inflation followed the urban rate lower from August’s 14.9 percent core reading. A third straight easing in October would extend the decline from March’s 15.2 percent high.
Sources: CAPMAS, Central Bank of Egypt, The Edge.