Oman’s Electricity Output Rises 4.3 Percent Through August as Muscat Generation Triples
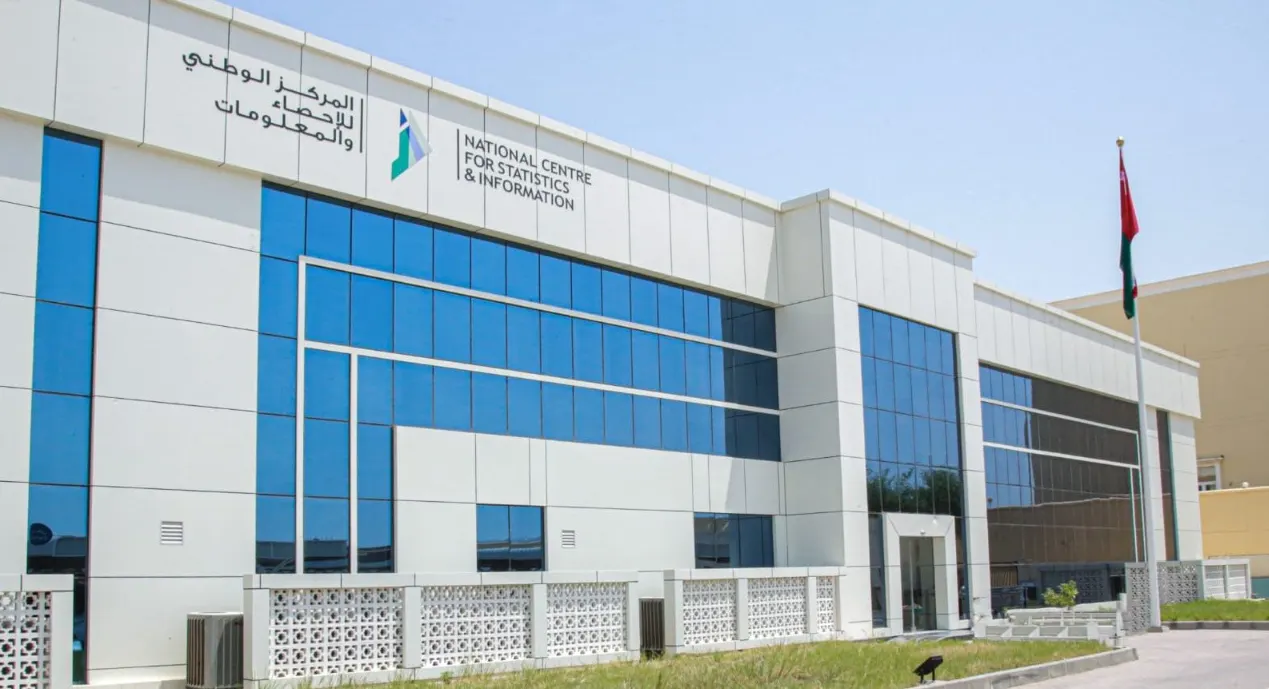
Oman generated 37,481.8 gigawatt hours of electricity in the first 8 months of 2026. That is 4.3 percent more than the 35,935.3 gigawatt hours of January to August 2025, according to preliminary data from the National Centre for Statistics and Information in a release dated 12 October. On our calculation, the country generated 1,546.5 gigawatt hours more than in the same 8 months of 2025. Net production, which includes purchases by Oman Power and Water Procurement Company and by Rural Areas Electricity Company, rose 4.6 percent to 36,463.9 gigawatt hours. Muscat governorate more than tripled its generation.
August Output Runs 3.0 Percent Above August 2025
Output has run more than 4 percent above 2025 in each of the 3 latest cumulative releases. Subtracting each cumulative total from the next gives the single months. On our calculation, August generation reached 5,749.3 gigawatt hours. That was 3.0 percent above the 5,580.7 gigawatt hours of August 2025 and 1.6 percent above July 2026.
Oman Electricity Output Keeps Growing in 2026
| Period | Gross output, GWh | Gross growth | Net growth |
|---|---|---|---|
| January to June | 26,075.3 | 5.7% | 5.9% |
| January to July | 31,732.5 | 4.5% | 4.9% |
| January to August | 37,481.8 | 4.3% | 4.6% |
Preliminary official data; growth is against the same months of 2025. Net output was 25,343.8 GWh to June, 30,866.7 GWh to July and 36,463.9 GWh to August.
August ran well above the first-half pace. On our calculation, August generation averaged 185.5 gigawatt hours a day, against 180.0 gigawatt hours a day in August 2025. The month’s 5,749.3 gigawatt hours was 32.3 percent above the average month of the first half, which was 4,345.9 gigawatt hours. On its own, August supplied 15.3 percent of everything generated in the 8 months.
August Output Up 3.0 Percent on Our Calculation
| Month | 2026, GWh | 2025, GWh | Change |
|---|---|---|---|
| August, gross | 5,749.3 | 5,580.7 | 3.0% |
| August, net | 5,597.2 | 5,450.3 | 2.7% |
Single months in this table and in the text are our calculation: the difference between consecutive cumulative preliminary releases for each year. Any revision to earlier months between releases falls into the derived month.
Muscat Leads the Governorates
Muscat recorded the fastest growth of any governorate in the release. Gross generation there rose 204.8 percent and net output 204.4 percent, so the capital’s output is now 3.05 times its January to August 2025 level on our calculation. The release does not say what drove the rise, and the figure measures generation in the governorate, not local consumption. The pace has also picked up through the year: Muscat’s cumulative growth was 170.2 percent at the end of June and 197.4 percent at the end of July. A’Dakhiliyah followed the same path, climbing from 39.5 percent to 44.1 percent over the same 3 releases.
Governorates Leading Oman’s Power Growth
| Governorate | To June | To July | To August |
|---|---|---|---|
| Muscat | 170.2% | 197.4% | 204.8% |
| A’Dakhiliyah | 39.5% | 41.8% | 44.1% |
| Al Wusta | 7.9% | 8.0% | 8.4% |
| North and South Al Batinah, A’Dhahirah | 6.2% | 5.6% | 5.5% |
| Dhofar | 8.5% | 5.4% | 4.6% |
Growth in gross electricity output against the same period of 2025, from the 3 latest preliminary cumulative releases.
On the net measure, Al Wusta rose 9.1 percent, Dhofar 7.6 percent and the Al Batinah and A’Dhahirah group 5.4 percent. In Dhofar’s case, net output grew 3.0 percentage points faster than gross output on our calculation. Musandam was steady: gross output was 376.0 gigawatt hours, with no significant change from a year earlier, and net output was 368.0 gigawatt hours, a change of 0.0 percent. Its net output equals 97.9 percent of its gross on our calculation.
The release gives growth rates rather than volumes for most governorates, so their shares of the national total cannot be worked out from it. Output fell in North and South A’Sharqiyah, reported together: gross generation there fell 16.4 percent and net output 16.6 percent. The release does not give a reason.
Net Output Outpaces Gross and Gas Use Climbs
Net production grew faster than gross output, at 4.6 percent against 4.3 percent. On our calculation, net output added 1,592.1 gigawatt hours in the 8 months, more than the 1,546.5 gigawatt hours added to gross generation. Net output now equals 97.3 percent of gross, up from 97.0 percent a year earlier. The difference between gross and net output narrowed by 4.3 percent, to 1,017.9 gigawatt hours from 1,063.5 gigawatt hours. In the single month of August, net output rose 2.7 percent to 5,597.2 gigawatt hours. Gross generation in July alone was 5,657.2 gigawatt hours on our calculation, 0.4 percent below July 2025, which accounts for most of the easing in the cumulative growth rate since June.
Gas use for generation rose faster still. A separate NCSI release on 7 October showed gas consumed by power stations up 13.8 percent at 11.7 billion cubic metres in January to August. That was 28.9 percent of the 40.5 billion cubic metres of gas Oman produced and imported, on our calculation; total gas supply was up 6.4 percent. Neither release explains why gas use grew faster than output. Industrial projects were the largest gas user, at 19.9 billion cubic metres, up 4.9 percent.
Water production was 3.5 percent lower, at 330,649.3 thousand cubic metres against 342,709.7 thousand cubic metres a year earlier. Muscat produced 128,068.6 thousand cubic metres, 6.2 percent less, and the other governorates outside Dhofar produced 149,899.6 thousand, 3.4 percent less. Dhofar moved the other way: its output rose 3.4 percent to 52,681.2 thousand cubic metres. On our calculation, that lifted Dhofar’s share of national water output to 15.9 percent from 14.9 percent.
Why it matters: In 8 months, Oman’s power system generated 1,546.5 gigawatt hours more than a year earlier, while the wider economy also expanded. The statistics centre’s 4 October release put real GDP growth in the second quarter of 2026 at 5.1 percent, and oil production rose 11.9 percent to 270.0 million barrels in January to August. Electricity growth of 4.3 percent, with August up 3.0 percent on our calculation, ran alongside that activity. Muscat’s threefold increase shows where generation is expanding fastest.
Outlook: The next cumulative release, covering January to September, will show whether August’s 3.0 percent year-on-year gain carries into September. It will also show whether Muscat and A’Dakhiliyah keep the rising growth rates of the last 3 releases. In water, Dhofar’s 3.4 percent rise is the series to follow, and the next oil and gas release will update the 13.8 percent growth in gas consumed by power stations.
Sources: National Centre for Statistics and Information, The Edge.