U.S. Bureau of Labor Statistics Preliminary Benchmark Finds March Payrolls 79,000 Below Estimate
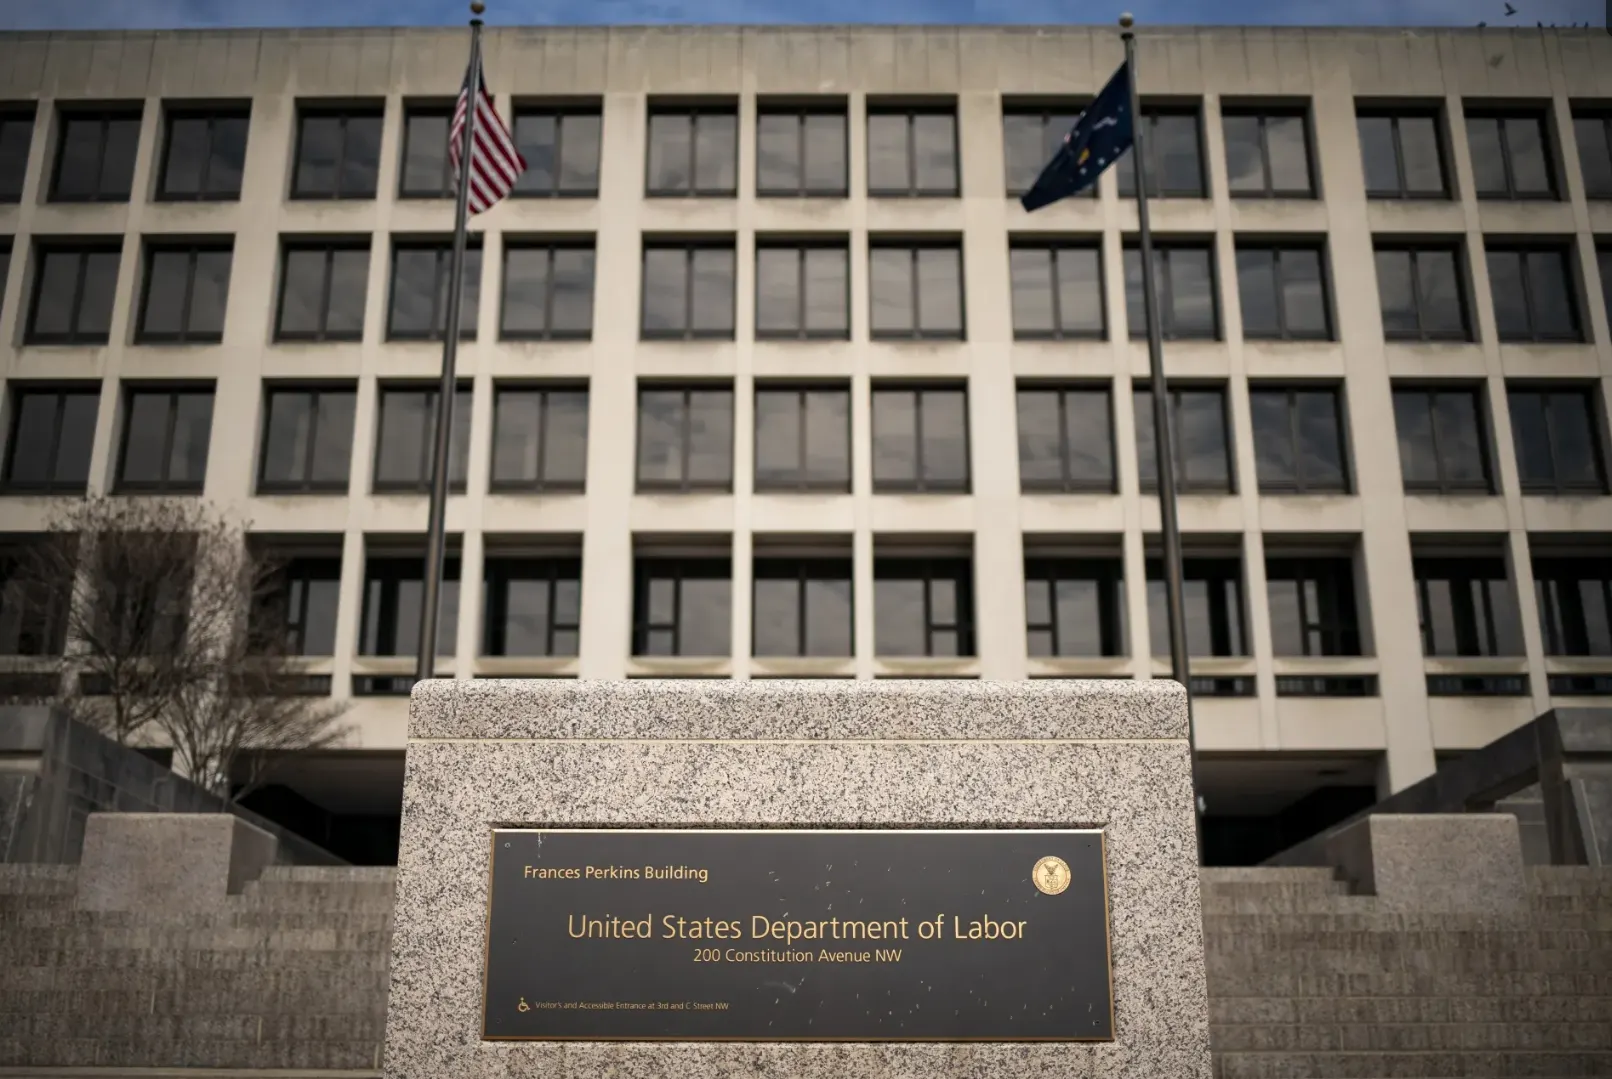
The U.S. Bureau of Labor Statistics said on Friday, August 28, 2026 that its preliminary annual benchmark review found the level of total nonfarm payroll employment for March 2026 was 79,000 jobs, or 0.1 percent, below the estimate produced by the monthly Current Employment Statistics survey, a far milder gap than the one found for the same month one year earlier. The same review found total private employment was 178,000 jobs, also 0.1 percent of the total private payroll count, below the monthly survey’s estimate, a larger gap in absolute terms than the total nonfarm figure.
A Far Smaller Reset Than Last Year’s
The bureau’s preliminary benchmark process compares the sample based Current Employment Statistics survey against a near complete census of employment drawn mainly from the Quarterly Census of Employment and Wages, built on state unemployment insurance tax records. The difference between the two independently derived employment counts produces the preliminary benchmark revision. The bureau notes that both counts have their own sources of error, and describes the benchmark difference as a preliminary measure of total error in CES employment estimates from March 2025 to March 2026.
1 year earlier, in a preliminary benchmark release dated September 9, 2025, the bureau reported a benchmark revision to March 2025 total nonfarm employment of 911,000 jobs, or 0.6 percent, with a benchmark revision to total private employment of 880,000 jobs, or 0.7 percent. On our calculation, this year’s total nonfarm revision of 79,000 is smaller than last year’s by 832,000, a reduction of about 91.3 percent. The total private revision of 178,000 is smaller than last year’s 880,000 by about 79.8 percent, on our calculation.
These are preliminary to preliminary comparisons. The March 2025 preliminary benchmark of 911,000 was itself superseded when the annual benchmark was finalized: the bureau’s January 2026 Employment Situation news release, published February 11, 2026 (USDL-26-0169), put the seasonally adjusted March 2025 total nonfarm employment level 898,000 lower, or 862,000 lower, 0.5 percent, on the not seasonally adjusted basis the preliminary benchmark itself uses, a smaller final gap than the 911,000 preliminary estimate. No comparable final figure for March 2026 will exist until the January 2027 Employment Situation release in February 2027.
The bureau’s own release states that the annual benchmark revision has averaged 0.2 percent of total nonfarm employment in absolute terms over the last 10 years. On our calculation, last year’s 0.6 percent revision was 3 times that 10 year average, while this year’s 0.1 percent reading is half of it. The final benchmark revision for March 2026 will be issued in February 2027, alongside the January 2027 Employment Situation report; official payroll estimates are not adjusted based on the preliminary figures released today.
Where the Revisions Landed by Industry
The bureau’s preliminary tables break the total nonfarm revision down by major industry sector. Construction, information, financial activities and government were all revised upward, while manufacturing, trade, transportation and utilities, professional and business services, private education and health services, leisure and hospitality, other services, and mining and logging were revised down.
| Sector | Revision (thousands) | Percent |
|---|---|---|
| Total nonfarm | (79) | (0.1%) |
| Total private | (178) | (0.1%) |
| Mining and logging | (6) | (1%) |
| Construction | 62 | 0.8% |
| Manufacturing | (67) | (0.5%) |
| Trade, transportation and utilities | (98) | (0.3%) |
| Information | 87 | 3% |
| Financial activities | 85 | 0.9% |
| Professional and business services | (76) | (0.3%) |
| Private education and health services | (96) | (0.3%) |
| Leisure and hospitality | (33) | (0.2%) |
| Other services | (36) | (0.6%) |
| Government | 99 | 0.4% |
Figures in parentheses are downward revisions. Within trade, transportation and utilities, the bureau’s release shows transportation and warehousing revised up by 135,100 and utilities up by 8,100, while retail trade was revised down by 154,600 and wholesale trade down by 86,200, on our reading of the same release.
The smaller total nonfarm revision partly reflects an offset between sectors: the 178,000 downward revision to total private employment was countered by a 99,000 upward revision to government employment, a combined net gap of 79,000, on our calculation.
States and Metro Areas Diverge
A companion release from the bureau, also dated August 28, 2026, covers the state and metropolitan area preliminary benchmark. The average absolute preliminary revision across all 50 states and the District of Columbia was 0.4 percent for March 2026, with preliminary benchmark levels higher in 28 states and the District and lower in 22 states. Revisions ranged from a reduction of 1.2 percent in North Dakota to an increase of 1.0 percent in Iowa and the District of Columbia. The average revision across all states and the District, not in absolute terms, was 0.0 percent, the bureau said.
Among the 56 metropolitan areas with a 2020 Census population of 1 million or more, the average absolute preliminary revision was 0.6 percent, with levels higher in 33 areas and lower in 23. The range ran from a reduction of 1.9 percent in Tucson, Arizona to an increase of 4.3 percent in Grand Rapids-Wyoming-Kentwood, Michigan. Final state and metropolitan area benchmark data are scheduled for March 2027, alongside the January 2027 State Employment and Unemployment release.
Why it matters:
The benchmark revision is the annual check on how accurately the monthly payroll survey tracked actual hiring, comparing the sample based survey against the benchmark drawn from near universal unemployment insurance records. A large revision signals that the monthly prints published throughout the year understated or overstated the true pace of hiring by a wide margin, which matters directly for how policymakers, employers and investors read the labor market in real time, before the slower moving administrative data catch up. Last year’s revision, at 0.6 percent of total nonfarm employment and 3 times the bureau’s own 10 year average, meant that the monthly reports covering the year to March 2025 had substantially overstated job growth. This year’s much smaller preliminary revision, at half that 10 year average, points to the monthly survey having tracked the underlying pace of hiring for the 12 months to March 2026 more closely than it did the year before, though the release is explicitly labeled preliminary and the final figure will not be confirmed until February 2027.
Outlook:
The bureau’s preliminary benchmark does not change any currently published payroll figures. The next monthly jobs report, the Employment Situation for August 2026, is scheduled for release on Friday, September 4, 2026. The Federal Reserve’s Federal Open Market Committee next meets on September 15 and 16, 2026, a meeting that will include updated economic projections. Because the preliminary benchmark points to less overstatement in the payroll survey over the past year than the bureau found 1 year earlier, it offers, on our reading, a modest reassurance on the reliability of the monthly prints policymakers read through March 2026, though the final, incorporated revision will not arrive until the January 2027 Employment Situation report in February 2027.
Sources: U.S. Bureau of Labor Statistics, Current Employment Statistics Preliminary Benchmark (National) news release, August 28, 2026 (USDL-26-1425); U.S. Bureau of Labor Statistics, Current Employment Statistics Preliminary Benchmark (State and Area) news release, August 28, 2026 (USDL-26-1426); U.S. Bureau of Labor Statistics, archived Current Employment Statistics Preliminary Benchmark (National) news release, September 9, 2025 (USDL-25-1352); U.S. Bureau of Labor Statistics, Employment Situation news release, January 2026 data, published February 11, 2026 (USDL-26-0169); U.S. Bureau of Labor Statistics, Employment Situation news release schedule; Federal Reserve, FOMC meeting calendar.