US Market Wrap 1 October: Stocks Start October Higher as the Two Year Yield Falls 10 Basis Points and Energy Leads
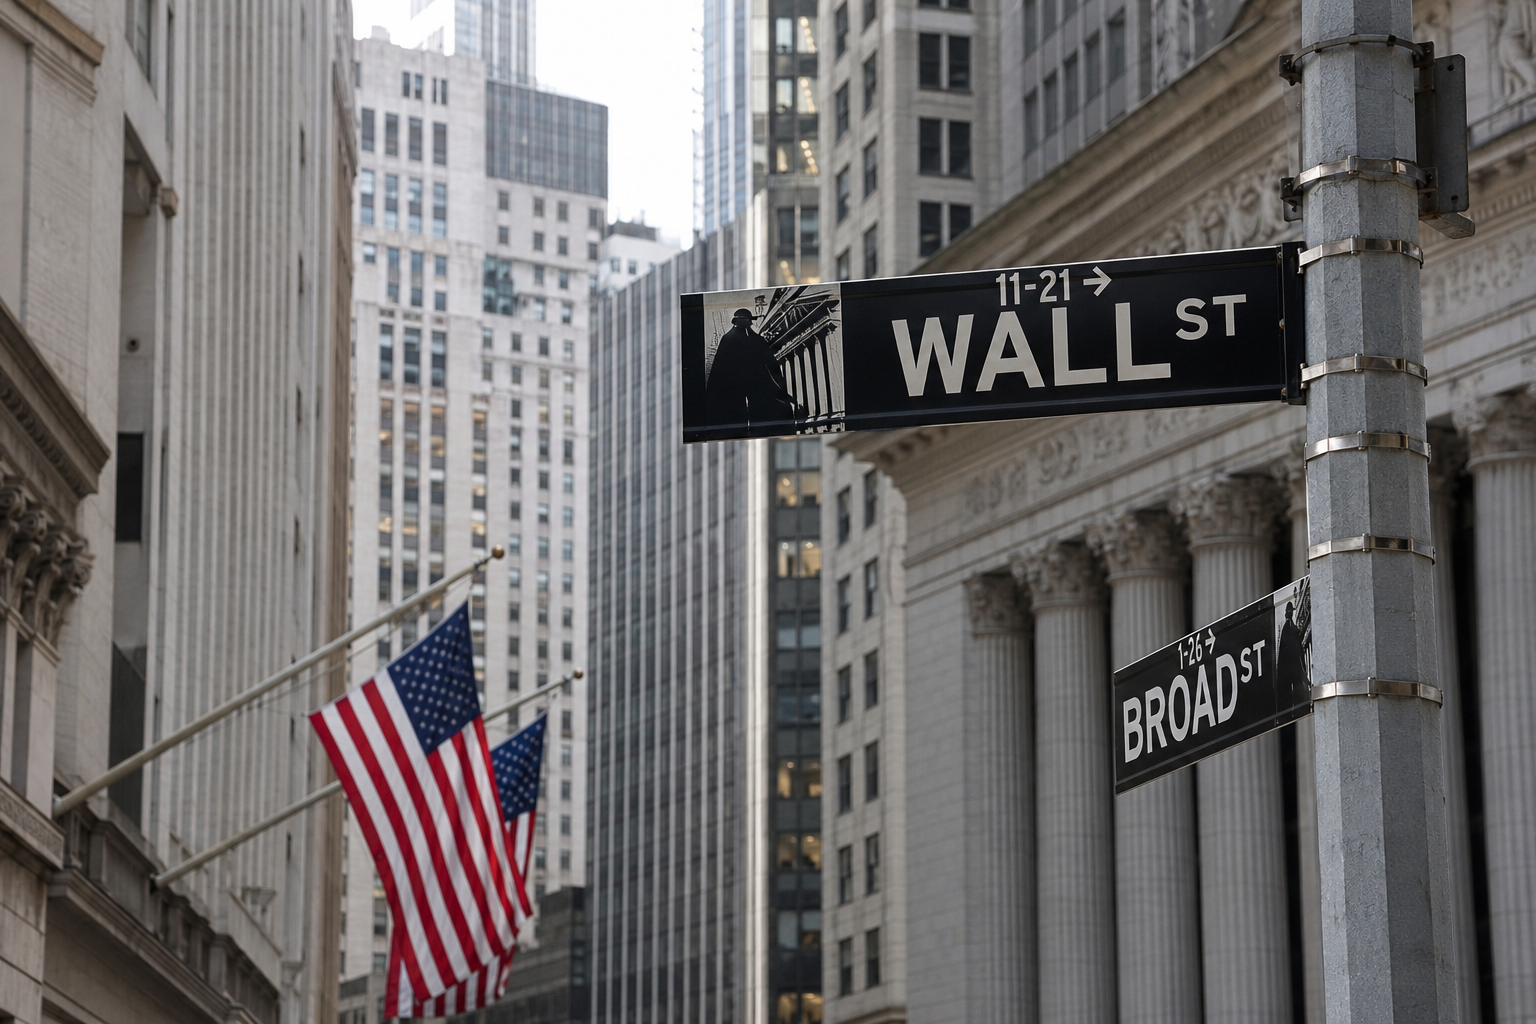
Stocks opened the fourth quarter higher and the bond market set the tone. The S&P 500 added 0.19 percent to close at 7,666.45 on Thursday, the Nasdaq Composite edged 0.04 percent higher to 26,871.60 and the Dow Jones Industrial Average inched up 20.51 points, or 0.04 percent, to 50,926.56, all three closes confirmed against the network’s own closing report, which had stocks clawing back early declines as Treasury yields retreated from their highest levels in more than twenty years. On the Treasury’s own daily table the official two year par yield fell 10 basis points to 4.78 percent and the 10 year eased to 5.24 from 5.29, off an intraday high the network’s closing report put at 5.344 percent, the highest going back to 2002. The Russell 2000 led the five boards we track at 0.35 percent, energy led the sectors at 1.92 percent on the day the barrel surged, and the commodities board is carried below from our Commodities Wrap of 1 October.
Energy leads five rising sectors as the barrel surges and small caps bounce
Five of the eleven sectors closed higher: energy led at 1.92 percent on the day Brent closed 4.4 percent higher at 102.31 dollars in the network’s written settlement report and WTI settled 2.7 percent up at 92.87, industrials added 1.00 percent, information technology 0.76, utilities 0.61 and financials 0.16, while health care’s 1.30 percent drop was the deepest sector fall, ahead of communication services at 1.19 percent. The network tied the crude move to a report that the United States is sending a third aircraft carrier strike group to the Middle East, with Marine Corps ships and up to 10,000 additional troops expected in the region by the end of November, per officials speaking to The Wall Street Journal as the network carried it, and the same report had three tankers coming under attack this week while transiting the Strait of Hormuz, per the maritime security agencies the network cited. The Russell 2000’s 0.35 percent rise led the five boards we track, a bounce the network set against a September it counted at more than 5 percent lower for the index and a third quarter down about 7.5 percent. On the single names as the network carried them, Accenture surged after fiscal fourth quarter results beat expectations, up 18 percent at midday as the network carried it, Micron closed 3 percent higher after a quarter in which the network said revenue quadrupled, with margin guidance below Street expectations on higher worker pay, and Alphabet released Gemini 4 Argon, which the network described as its most advanced model yet.
The front of the curve rallies as hike odds come out of October
The official par curve fell at every maturity we publish, led from the front: the two year dropped 10 basis points to 4.78 percent, the three year 9 to 4.91, the five year 8 to 5.01, the 10 year 5 to 5.24 and the 30 year 3 to 5.61, widening the gap between the two year and the 30 year to 83 basis points from Wednesday’s 76, with the 1 October readings taken at the Treasury’s own daily table and the changes our own arithmetic against Wednesday’s published row. The network’s closing report had the 10 year at an intraday 5.344 percent, its highest going back to 2002, before the turn by late morning, and its strategist entry put the short end’s slide down to positioning: the two year’s fall is “likely just investors pricing out the odds the Fed needs to hike this month”, the Baird strategist said as the network quoted him, adding that a weaker jobs number “could all but cement a Fed hold in October”. The Federal Reserve’s vice chairman, in remarks the network carried, said future policy adjustments should be determined by examining the data and the balance of risks, a judgment that “may take more time”. The day’s data ran the same way as the network carried it: the ISM manufacturing index was little changed at 54.5 in September with its prices gauge surging to 77.9, initial jobless claims came in at 197,000, and the Challenger count of announced September job cuts fell 18 percent from August to 43,281, the lowest September total since 2022, with the January to September total of 573,195 down 39 percent from the same period of 2025, per the firm’s own release.
Strongest gains
| Index | Close | Change |
|---|---|---|
| Russell 2000 | 2,806.63 | +0.35% |
| Nasdaq 100 | 30,501.56 | +0.31% |
| S&P 500 | 7,666.45 | +0.19% |
Closes of Thursday 1 October 2026 from the vendor feed after the 20:00 GMT close, read at 20:27 GMT and unchanged on a second read at 20:30, ranked by change; every change is measured against our published Wednesday 30 September closes, and the three main averages’ closes match the network’s own closing report exactly. All five boards closed higher on Thursday, so the usual gainers and losers split is published tonight as the strongest and the shallowest gains, with the reason disclosed here.
Shallowest gains
| Index | Close | Change |
|---|---|---|
| Nasdaq Composite | 26,871.60 | +0.04% |
| Dow Jones Industrial Average | 50,926.56 | +0.04% |
Closes of Thursday 1 October 2026, same basis and reads as the board above; the two shallowest rises of the five, both rounding to the same figure and ranked by their unrounded changes, the Composite’s the smaller.
S&P 500 sectors
| Sector | Change |
|---|---|
| Energy | +1.92% |
| Industrials | +1.00% |
| Information technology | +0.76% |
| Real estate | -0.62% |
| Communication services | -1.19% |
| Health care | -1.30% |
Top 3 and bottom 3 of the 11 S&P 500 sectors, same basis as the index boards; five of the eleven closed higher. Omitted: utilities +0.61 percent, financials +0.16, consumer discretionary -0.15, consumer staples -0.29, materials -0.45.
US Treasury par yield curve
| Maturity | 1 Oct | 30 Sep | Change |
|---|---|---|---|
| 2 Year | 4.78% | 4.88% | -10 bp |
| 3 Year | 4.91% | 5.00% | -9 bp |
| 5 Year | 5.01% | 5.09% | -8 bp |
| 10 Year | 5.24% | 5.29% | -5 bp |
| 30 Year | 5.61% | 5.64% | -3 bp |
The official daily par yield curve for 1 October and 30 September 2026, read at the US Treasury’s own daily table at 20:06 GMT, the 1 October row from the table’s October view and the 30 September row from its September view, exact to our published record; the Treasury derives the curve from indicative bid side quotations at about 19:30 GMT in US summer time, and the changes are ours. Omitted maturities on 1 October: 1 month 4.06 percent, 1.5 month 4.10, 2 month 4.13, 3 month 4.17, 4 month 4.26, 6 month 4.27, 1 year 4.44, 7 year 5.12, 20 year 5.64.
Commodities
| Contract | Level | Change |
|---|---|---|
| Gold, COMEX (Dec’26), dollars an ounce | $4,206.80 | +0.48% |
| Silver, COMEX (Dec’26), dollars an ounce | $61.235 | +1.10% |
| Brent Crude, ICE (Dec’26), dollars a barrel | $102.34 | +4.40% |
| WTI Crude, NYMEX (Nov’26), dollars a barrel | $92.92 | +2.76% |
Carried verbatim from our Commodities Wrap of 1 October 2026: evening levels as of 19:18 GMT on Thursday, measured against Wednesday’s settlements as carried in the price feed, session readings, not the official settlements; the Brent row is the December 2026 contract, measured against its own Wednesday settlement of 98.03 dollars, as disclosed there. The network’s written settlement report for Thursday had Brent closing at 102.31 dollars and WTI settling at 92.87.
Currencies, volatility and crypto
| Instrument | Level | Change |
|---|---|---|
| Cboe Volatility Index (VIX) | 16.39 | +0.31% |
| Bitcoin, dollars | 84,756.59 | +1.29% |
| US Dollar Index (DXY) | 102.027 | +0.57% |
| Euro/Dollar | 1.1243 | -0.75% |
| Sterling/Dollar | 1.3196 | -0.52% |
| Dollar/Yen | 158.07 | +0.43% |
Quotes as of 20:27 GMT on Thursday 1 October 2026, fixed row order; the VIX row is the session’s last level on the vendor’s feed after the United States cash close.
Asia, session of Thursday 1 October
| Index | Close | Change |
|---|---|---|
| Nikkei 225 (Japan) | 68,956.72 | +3.30% |
| Kospi (South Korea) | 6,971.35 | +1.95% |
| Taiex (Taiwan) | 48,353.49 | +0.86% |
| Topix (Japan) | 4,131.98 | +0.57% |
| Straits Times (Singapore) | 5,667.67 | -0.14% |
| Nifty 50 (India) | 22,421.95 | -0.88% |
| S&P/ASX 200 (Australia) | 8,614.40 | -1.99% |
Carried whole from our Asia Market Wrap of 1 October 2026, gainers then losers, rows verbatim on the basis published there; the Nifty 50 row is the National Stock Exchange of India’s own close, and the mainland China boards are closed through 7 October with Hong Kong shut for Thursday’s session only, all as disclosed there.
Middle East, session of Thursday 1 October
| Index | Close | Change |
|---|---|---|
| EGX 30 (Egypt) | 53,055.03 | +2.24% |
| MSX 30 (Oman) | 7,598.512 | +0.42% |
| ASE Index (Jordan) | 4,206.57 | +0.38% |
| Bahrain All Share (Bahrain) | 1,904.50 | -0.17% |
| Tadawul All Share (Saudi Arabia) | 10,392.97 | -0.46% |
| DFM General (Dubai) | 5,930.40 | -0.51% |
| QE Index (Qatar) | 9,192.24 | -0.57% |
| FTSE ADX General (Abu Dhabi) | 9,998.24 | -0.72% |
| Kuwait All Share (Kuwait) | 8,713.71 | -0.75% |
Carried from our Middle East Market Wrap of 1 October 2026, gainers then losers, rows verbatim on the basis published there; the Dubai change is the exchange’s own daily closing figure and the Tadawul All Share and EGX 30 percentage changes are the exchanges’ own prints, as disclosed there.
Europe, session of Thursday 1 October
| Index | Close | Change |
|---|---|---|
| DAX (Germany), Xetra close | 24,939.35 | -1.03% |
| AEX (Netherlands) | 1,102.63 | -1.10% |
| Stoxx Europe 600 (Europe) | 626.65 | -1.30% |
| Euro Stoxx 50 (euro area) | 6,175.45 | -1.49% |
| SMI (Switzerland) | 13,622.85 | -1.50% |
| CAC 40 (France) | 7,835.31 | -1.62% |
| FTSE 100 (United Kingdom) | 10,428.27 | -1.68% |
| IBEX 35 (Spain) | 19,005.30 | -2.17% |
| FTSE MIB (Italy) | 50,237.86 | -2.21% |
Carried from our Europe Market Wrap of 1 October 2026, rows verbatim on the basis published there, where all nine boards closed lower for a second straight session and the table was split by depth of decline, from the shallowest here to the deepest; the Stoxx rows are the indices’ official dissemination and the DAX row is Deutsche Boerse’s published Xetra closing price, all as disclosed there.
Why it matters: The quarter opened true to the pattern the network’s closing report described, stocks moving opposite yields: on a day the official two year yield fell 10 basis points, all five boards we track closed higher even with Brent settling more than 4 percent up. The move in rates came from the front of the curve, where the strategist entry the network carried read the two year’s drop as October’s hike being priced out, and the gap between the two year and the 30 year still widened to 83 basis points because the front fell faster than the long end. Energy and industrials did the index work while health care and communication services paid for it, and the barrel’s surge reached the sector table without unsettling the averages.
Outlook: Friday’s September employment report is the week’s test, at the 84,000 nonfarm payrolls consensus the network carried in Wednesday’s closing report, as published in our 30 September wrap, and the strategist the network quoted on Thursday had a weaker number all but cementing an October hold. In Asia, Hong Kong reopens on Friday against Wednesday’s 24,613.27 close across one shut session, and the mainland boards stay closed through 7 October, as disclosed in our Asia Market Wrap of 1 October. Tomorrow’s boards measure against tonight’s closes, with the crude references the written settlements of 102.31 dollars for Brent and 92.87 for WTI, as the network published them.
Sources: CNBC, Challenger Gray and Christmas, US Department of the Treasury, The Edge.