
US Market Wrap 15 October: The Dow Rises 1.08 Percent as Money Rotates Out of the AI Trade
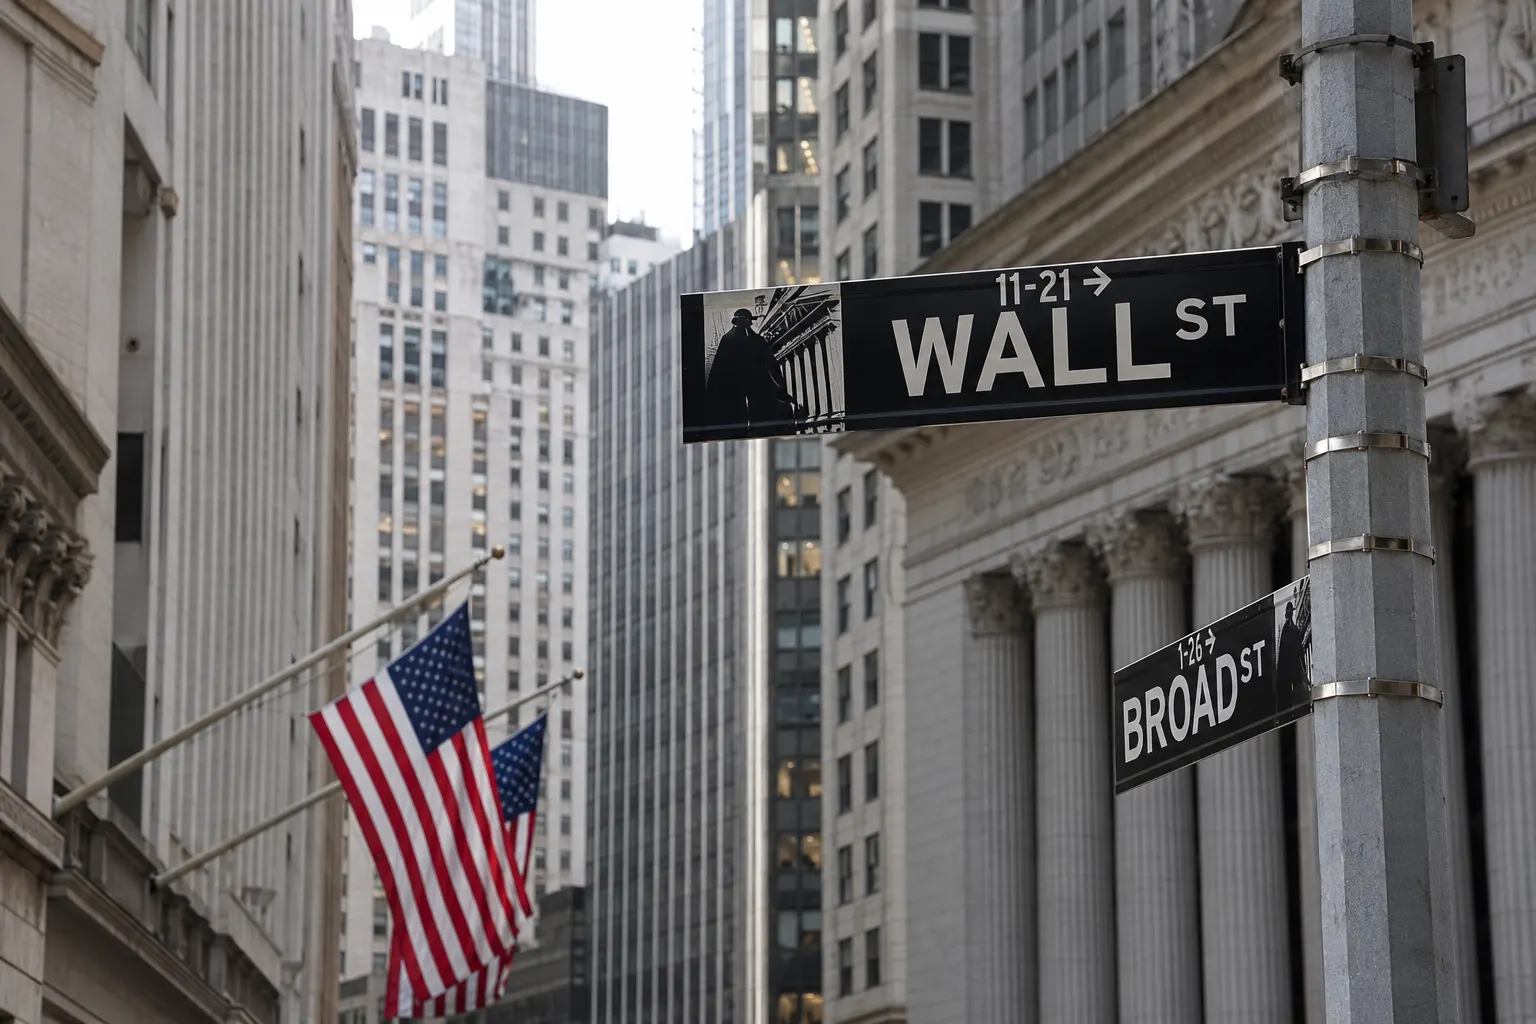
The Dow Jones Industrial Average rose 556.21 points, or 1.08 percent, to 52,177.69 on Thursday as investors rotated out of the AI trade and into the rest of the board, on CNBC’s account of the session, with the Russell 2000 leading at 1.38 percent; the Nasdaq 100 fell 0.05 percent for a fourth straight decline while the four other indices snapped their slides. Treasury yields from one year out fell through the hottest producer-price reading since 2022, the 10 year 9 basis points lower at 5.10 percent, and the VIX fell 2.43 percent. WTI settled 3.03 percent higher at 97.97 dollars a barrel on the week’s large US crude draw, as published in this evening’s Commodities Wrap.
The hottest producer prices since 2022 meet a curve that rallies anyway
The US producer price index for final demand rose 1.3 percent in September, the largest monthly advance since March 2022, and 6.3 percent over the twelve months, the largest such rise since December 2022, the Bureau of Labor Statistics reported; goods prices rose 2.6 percent, the biggest increase since that series began in December 2009, with over 80 percent of the rise attributable to energy, up 10.8 percent, while services prices advanced 0.8 percent and the index excluding foods, energy and trade services rose 0.5 percent on the month and 5.0 on the year. The rate market read it and eased anyway: interest rate traders priced about a 30 percent chance of a Federal Reserve increase this month, per CME FedWatch figures carried by Reuters, against the 37 percent our Wednesday wrap recorded at that session’s close, after San Francisco Fed President Mary Daly and Vice Chair for Supervision Michelle Bowman signalled an immediate increase might not be required, and the wire counts Fed Chair Kevin Warsh’s remarks at the International Monetary Fund’s annual meeting, at 03:30 GMT on Friday, as the next clue before this month’s meeting. The Treasury’s official par yield curve fell across every maturity of a year or longer even as the one-month and two-month bill yields rose: the one year 4 basis points lower at 4.49 percent, the two year 5 lower at 4.77, the 10 year 9 lower at 5.10, a three-week low the wire’s account also carried, and the 30 year 9 lower at 5.43, the two to ten year spread narrowing 4 basis points to 33 on our arithmetic.
Memory-glut fears unwind the AI trade into value
The rotation ran along the line the chip complex drew overnight: Seagate Technology and Western Digital added to their declines this week alongside SK Hynix, the stock that drove the Kospi’s 7.57 percent rout through a circuit breaker in our Asia wrap of this morning, as traders weighed a potential memory chip glut against rising Chinese competition, and Tesla chief executive Elon Musk wrote on X that China will be making a lot of RAM in 2028, as CNBC carried the session. The same account had Anthropic’s third-quarter revenue growing to 16.8 billion dollars per CNBC’s sources, with some traders asking whether that pace justifies the chip complex’s valuations, while parts of the trade recovered, CoreWeave closing almost 6 percent higher after Wednesday’s 15 percent fall and Micron nearly 2 percent up. The money went to value: Walmart rose 1.5 percent and Nike jumped more than 5, with MAI Capital Management’s Alex Shahidi telling CNBC that investors are weighing 5 percent Treasury yields against the size of their AI concentration rather than abandoning the trade. Health care led the sectors at 1.84 percent for a second day, the same rotation our Europe wrap recorded through the print, with materials up 1.71 and financials 1.38 after two declines, while energy fell 1.55 percent against crude’s split settlements and technology lost 0.54 in a second decline, eight of the eleven sectors higher on the day. The VIX fell 2.43 percent to 16.46, unwinding part of Wednesday’s inflation spike.
Top gainers
| Index | Close | Change |
|---|---|---|
| Russell 2000 | 2,767.27 | +1.38% |
| Dow Jones Industrial Average | 52,177.69 | +1.08% |
| S&P 500 | 7,744.06 | +0.33% |
| Nasdaq Composite | 26,713.03 | +0.08% |
Closes of Thursday 15 October 2026 from the price feed, ranked by change against Wednesday’s closes as published; the Russell 2000 and the Nasdaq Composite snapped three-session slides and the Dow a two-session one, with the S&P 500’s gain its first in four sessions.
Top losers
| Index | Close | Change |
|---|---|---|
| Nasdaq 100 | 29,935.60 | -0.05% |
The only decline on the board, same read and basis; a fourth straight session lower for the index, the board’s longest current run.
S&P 500 sectors
| Sector | Close | Change |
|---|---|---|
| Health Care | 2,065.05 | +1.84% |
| Materials | 641.05 | +1.71% |
| Financials | 918.88 | +1.38% |
| Utilities | 422.99 | -0.21% |
| Technology | 7,090.52 | -0.54% |
| Energy | 1,024.36 | -1.55% |
The three strongest and three weakest of the eleven sectors, same read and basis; omitted middle: consumer discretionary +1.16 percent at 1,871.91, real estate +1.00 at 268.07, communication services +0.62 at 476.34, industrials +0.49 at 1,420.80 and consumer staples +0.37 at 969.52; eight of eleven rose.
US Treasury par yield curve
| Maturity | 15 Oct | 14 Oct | Change |
|---|---|---|---|
| 2 Year | 4.77% | 4.82% | -5 bp |
| 3 Year | 4.85% | 4.92% | -7 bp |
| 5 Year | 4.91% | 5.00% | -9 bp |
| 10 Year | 5.10% | 5.19% | -9 bp |
| 30 Year | 5.43% | 5.52% | -9 bp |
The official daily par yield curve for 15 and 14 October 2026, read at the US Treasury’s own daily table, with the 14 October row exact to our published record; every maturity of a year or longer fell, deepest from the five year out, while the one-month and two-month bill yields rose.
Commodities
| Contract | Level | Change |
|---|---|---|
| Gold, COMEX (Dec’26), dollars an ounce | $4,170.10 | +1.51% |
| Silver, COMEX (Dec’26), dollars an ounce | $57.156 | +2.29% |
| Brent Crude, ICE (Dec’26), dollars a barrel | $105.92 | -0.13% |
| WTI Crude, NYMEX (Nov’26), dollars a barrel | $97.97 | +3.03% |
Carried unchanged from this evening’s settlements update of our Commodities Wrap of 15 October 2026: Thursday’s settlements against Wednesday’s, with the Brent and WTI rows verified against the wire’s settlement report and the gold and silver rows the feed’s settlement prices, as disclosed there.
Currencies, volatility and crypto
| Instrument | Level | Change |
|---|---|---|
| VIX | 16.46 | -2.43% |
| Bitcoin, dollars | $82,308.55 | +0.76% |
| US Dollar Index (DXY) | 102.03 | -0.51% |
| Euro/Dollar | 1.1214 | +0.52% |
| Sterling/Dollar | 1.3271 | +0.61% |
| Dollar/Yen | 158.09 | -0.14% |
Quotes at 20:23 GMT, in fixed order; snapshots, not settlements. The VIX row is the index’s 20:15 GMT closing print on its stated feed, and every change is the feed’s own against its previous-day values.
Asia, session of Thursday 15 October
| Index | Close | Change |
|---|---|---|
| Nifty 50 (India) | 22,997.35 | +1.66% |
| S&P/ASX 200 (Australia) | 8,719.70 | -0.09% |
| Straits Times (Singapore) | 5,403.50 | -0.37% |
| Hang Seng (Hong Kong) | 24,062.72 | -1.03% |
| Shanghai Composite (China) | 3,707.48 | -1.59% |
| Topix (Japan) | 3,999.34 | -2.38% |
| Shenzhen Component (China) | 11,816.79 | -2.43% |
| Taiex (Taiwan) | 46,969.87 | -3.41% |
| Nikkei 225 (Japan) | 64,425.95 | -4.90% |
| Kospi (South Korea) | 5,554.22 | -7.57% |
Carried whole from our Asia Market Wrap of Thursday 15 October 2026, the gainer then the losers in its published order; the Nifty row is the exchange’s own figure.
Middle East, session of Thursday 15 October
| Index | Close | Change |
|---|---|---|
| EGX 30 (Egypt) | 52,273.34 | +1.52% |
| ASE Index (Jordan) | 4,213.75 | -0.20% |
| Bahrain All Share (Bahrain) | 1,876.01 | -0.20% |
| FTSE ADX General (Abu Dhabi) | 9,804.54 | -0.30% |
| Tadawul All Share (Saudi Arabia) | 10,106.54 | -0.32% |
| Boursa Kuwait All-Share (Kuwait) | 8,475.93 | -0.68% |
| MSX 30 (Oman) | 7,678.054 | -1.00% |
| DFM General (Dubai) | 5,830.47 | -1.05% |
| QE Index (Qatar) | 8,810.17 | -1.35% |
Carried whole from our Middle East Market Wrap of 15 October 2026, the gainer then the losers in its published order; the Amman and Doha changes are our arithmetic, as disclosed there.
Europe, session of Thursday 15 October
| Index | Close | Change |
|---|---|---|
| SMI (Switzerland) | 14,349.51 | +1.55% |
| FTSE 100 (UK) | 10,840.35 | +1.08% |
| CAC 40 (France) | 7,934.70 | +0.78% |
| DAX (Germany) | 25,382.62 | +0.33% |
| STOXX Europe 600 (Europe) | 639.85 | +0.33% |
| IBEX 35 (Spain) | 19,177.70 | -0.28% |
| Euro STOXX 50 (Euro area) | 6,166.09 | -0.39% |
| AEX (Netherlands) | 1,132.58 | -0.40% |
| FTSE MIB (Italy) | 49,397.55 | -0.72% |
Carried whole from our Europe Market Wrap of 15 October 2026, its gainers then its losers in their published order; five of the nine rose, as disclosed there, with the DAX and STOXX Europe 600 tie ranked on the unrounded arithmetic.
Why it matters: A rotation, not a retreat: the Dow’s 556-point rise against the Nasdaq 100’s fourth straight decline prices the AI-concentration question in a single line, and the Treasury market from one year out read the hottest producer prices since 2022 and rallied anyway as the hike odds eased. The rout that began in Seoul ended as value rotation in New York, through Europe’s health-care-led session in between, and the breadth, eight sectors of eleven higher under a flat Nasdaq, is the tell.
Outlook: Fed Chair Kevin Warsh speaks at the International Monetary Fund’s annual meeting at 03:30 GMT on Friday, on the wire’s account, ahead of this month’s Fed meeting. Friday’s wraps measure against tonight’s board, with the crude series on the settlements published in this evening’s Commodities Wrap, and Asia opens on a split Wall Street.
How these wraps are prepared: Methodology.
Sources: CNBC, Reuters, US Bureau of Labor Statistics, US Department of the Treasury, The Edge.




