US Market Wrap 21 September: The Nasdaq Closes at a Record on an AI Surge as Oil and Yields Slide
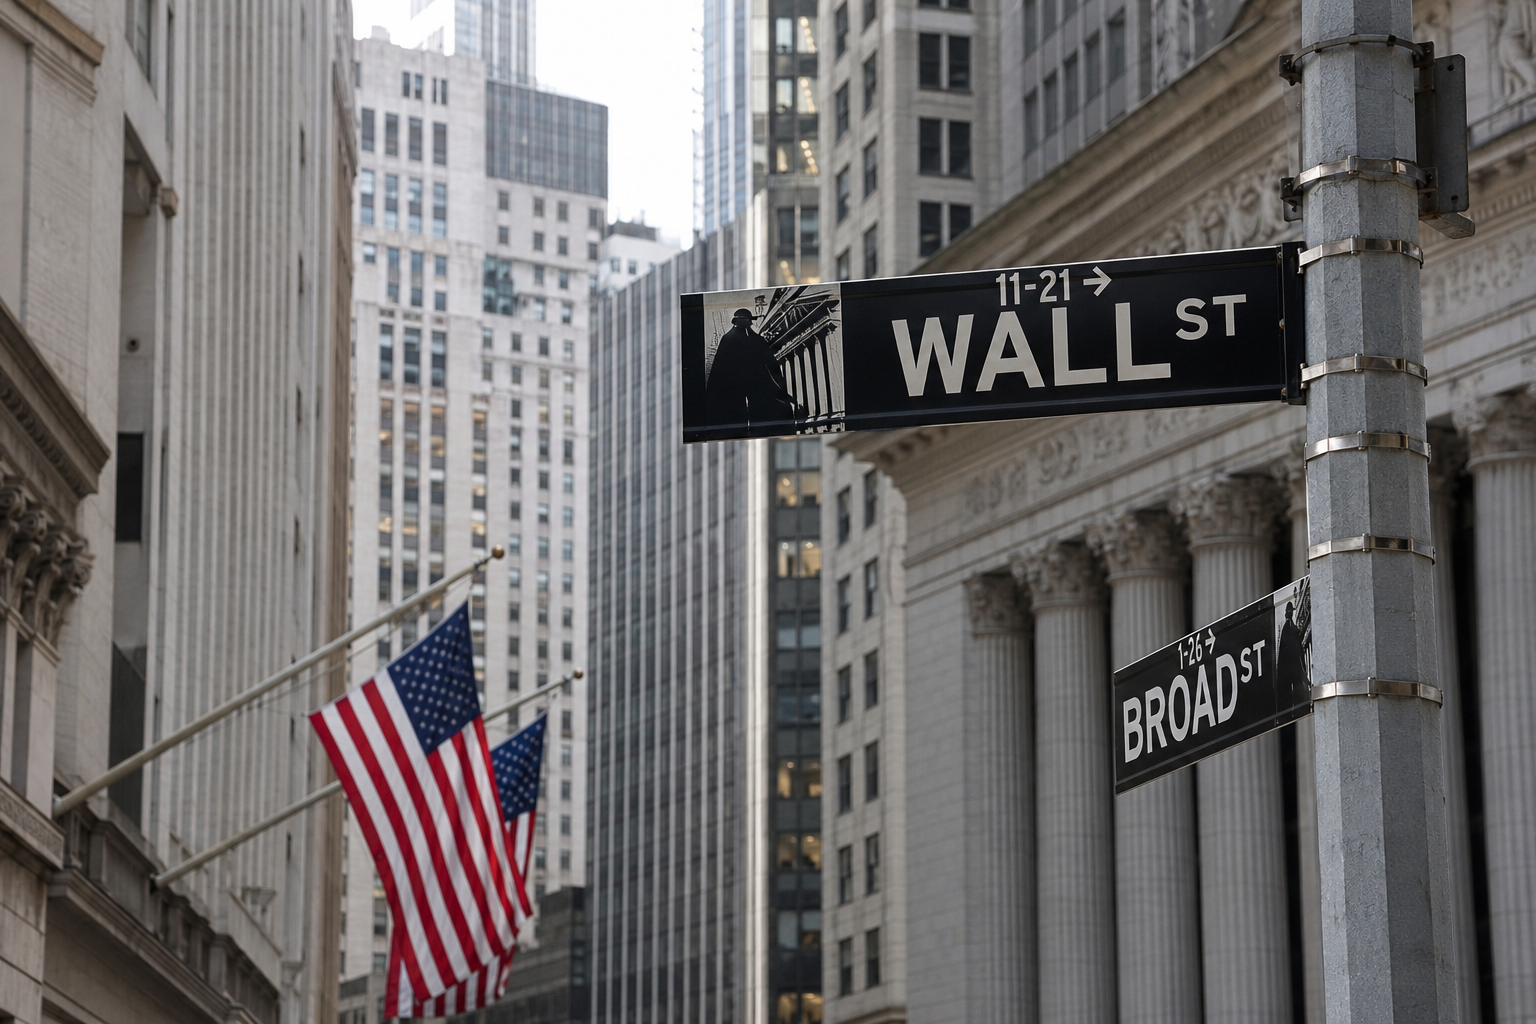
Wall Street turned last week’s caution into a record on Monday: the Nasdaq Composite jumped 2.26 percent to close at 27,122.09, its first record close since June, per the network’s closing report, while the S&P 500 climbed 1.49 percent to 7,764.70 and the Dow Jones Industrial Average added 366.19 points, or 0.71 percent, to 52,048.83, as artificial intelligence names surged and oil and Treasury yields slid. WTI settled 4.5 percent lower at 95.78 dollars a barrel, per our commodities wrap of tonight, and the 10 year par yield fell 5 basis points to 4.96 percent, back under the 5 percent line on the Treasury’s own curve.
AI names carry the tape to a record close
The advance ran through the chipmakers and the platforms. Intel popped 12 percent, Advanced Micro Devices added almost 10 percent and topped 1 trillion dollars in market capitalization for the first time, on an intraday high of 613.92 dollars, and Qualcomm rose 9 percent, per the network’s entries, while Meta Platforms traded up nearly 12 percent in the afternoon, pacing its best day since 9 April 2025, and the Magnificent Seven tracking fund printed a fresh all time high and a second straight session at a record. The sector board tells the same story: communication services led the 11 S&P 500 sectors at 3.86 percent higher, with information technology up 2.46 percent and consumer discretionary 1.49 percent, while energy fell 2.57 percent, the board’s deepest decline, as crude settled sharply lower. The record arrived on a seasonal turn the network’s reporting flagged: Sam Stovall, chief investment strategist at CFRA, pointed to the “Sell Rosh Hashana, buy Yom Kippur” adage with Monday the day of Yom Kippur, said technicians “feel that we might be in the process of confirming a bullish flag breakout”, and noted that in data going back to World War II the S&P 500 has averaged a total return of more than 20 percent in the 12 months after midterm election years. The turn follows a week in which the Dow slid 1.7 percent, its worst since March, per the network, and the S&P 500 was off about 0.1 percent, with only the Nasdaq higher.
Oil’s slide pulls yields down and the crypto bid returns
The other half of the session sits in the oil column and what it loosened. Monday’s advance was aided by the crude slide, per the network’s closing report, with WTI settling 4.5 percent lower at 95.78 dollars and Brent at 100.24, per our commodities wrap (the closing wire prints Brent at 100.34 a barrel), and the Treasury’s par curve rallied with it: the 10 year fell 5 basis points to 4.96 percent, the 30 year 5 to 5.29, and the 2 year held at 4.76, so the move came out of the long end. The two readings of that slide frame the week, on our reading: Ed Yardeni, president of Yardeni Research, wrote in a Monday note the network carried that “Higher-for-longer energy prices add to the case for further tightening” and that “The longer this energy shock persists, the greater the risk of second-round inflation effects”, while Jeffrey Roach, chief economist at LPL Financial, wrote that Fed Chairman Kevin Warsh’s committee “has conditioned its inflation outlook on oil markets settling down, and Beijing’s fiscal calculus runs through the same variable”. Bitcoin traded 6.83 percent higher at 86,728.32 dollars at our capture, above the earlier print the network called its highest level since January, with last week’s regulatory moves, a temporary path for tokenized stocks at the SEC and proposed crypto market rules from the CFTC, easing uncertainty and more than 300 million dollars of short positions liquidated over 24 hours, per CoinGlass figures the network cited. The Cboe Volatility Index finished at 14.87, 0.41 percent higher on the day.
Top gainers
| Index | Close | Change |
|---|---|---|
| Nasdaq 100 | 30,482.35 | +2.83% |
| Nasdaq Composite | 27,122.09 | +2.26% |
| S&P 500 | 7,764.70 | +1.49% |
| Dow Jones Industrial Average | 52,048.83 | +0.71% |
| Russell 2000 | 2,875.35 | +0.52% |
Top gainers, closes of Monday 21 September 2026 from the vendor feed, confirmation pull at 20:17 GMT with a second index only pull at 20:19 GMT identical, ranked by change; every change reconciles against our published Friday 18 September closes, and the headline closes match the network’s written closing figures exactly.
Top losers
| Index | Close | Change |
|---|---|---|
| Nil | Nil | Nil |
Top losers, same session, basis and capture as the gainers table. No index fell; all 5 rose and are ranked in the gainers table above.
S&P 500 sectors
| Sector | Change |
|---|---|
| Communication services | +3.86% |
| Information technology | +2.46% |
| Consumer discretionary | +1.49% |
| Consumer staples | -0.37% |
| Utilities | -0.43% |
| Energy | -2.57% |
Top 3 and bottom 3 of the 11 S&P 500 sectors, closes of Monday 21 September 2026 from the vendor feed at the same 20:17 GMT capture, ranked.
US Treasury par yield curve
| Maturity | 21 Sep | 18 Sep | Change |
|---|---|---|---|
| 2 year | 4.76% | 4.76% | 0bp |
| 3 year | 4.82% | 4.83% | -1bp |
| 5 year | 4.83% | 4.86% | -3bp |
| 10 year | 4.96% | 5.01% | -5bp |
| 30 year | 5.29% | 5.34% | -5bp |
Daily par yields from the US Treasury’s own page, read at 20:24 GMT with the 21 September row posted; changes are ours by subtraction against the 18 September row, which matches our published curve exactly.
Commodities
| Contract | Level | Change |
|---|---|---|
| Gold, COMEX (Dec’26), dollars an ounce | $4,385.80 | -0.88% |
| Silver, COMEX (Dec’26), dollars an ounce | $66.495 | -0.97% |
| Brent Crude, ICE (Nov’26), dollars a barrel | $100.33 | -3.41% |
| WTI Crude, NYMEX (Oct’26), dollars a barrel | $95.72 | -4.57% |
Carried verbatim from our Commodities Wrap of 21 September 2026 on the basis it published: post settlement window snapshots at 18:47 GMT measured against Friday’s settlements as carried in the price feed, not the official settlements. The wire settlements, WTI 95.78 and Brent 100.24 dollars, are cited in the prose per the same wrap.
Instruments
| Instrument | Level | Change |
|---|---|---|
| Cboe Volatility Index (VIX) | 14.87 | +0.41% |
| Bitcoin, dollars | 86,728.32 | +6.83% |
| US Dollar Index (DXY) | 100.435 | +0.21% |
| Euro/Dollar | 1.1463 | -0.17% |
| Sterling/Dollar | 1.3364 | -0.22% |
| Dollar/Yen | 157.42 | +0.36% |
One call at the same 20:17 GMT capture, fixed order; the VIX row is the session’s last print on its stated feed, and the currency and crypto rows are snapshot levels on the vendor’s daily basis.
Asia reference
| Index | Close | Change |
|---|---|---|
| Kospi (South Korea) | 7,007.72 | +1.65% |
| Hang Seng (Hong Kong) | 25,042.71 | +1.18% |
| Taiex (Taiwan) | 47,718.84 | +1.14% |
| Shanghai Composite (China) | 3,949.91 | +0.97% |
| Shenzhen Component (China) | 13,730.02 | +0.65% |
| Straits Times (Singapore) | 5,675.23 | +0.34% |
| Nifty 50 (India) | 23,414.30 | +0.29% |
| S&P/ASX 200 (Australia) | 8,731.90 | +0.01% |
Carried whole from our Asia Market Wrap of 21 September 2026, closes of Monday 21 September on the vendor feed basis published there; no index that traded fell, and Japanese markets were closed for a public holiday, so the Nikkei 225 and Topix carry no session.
Middle East reference
| Index | Close | Change |
|---|---|---|
| QE Index (Qatar) | 9,559.05 | +0.09% |
| DFM General (Dubai) | 5,960.24 | +0.05% |
| Kuwait All Share (Kuwait) | 8,846.45 | -0.02% |
| MSX 30 (Oman) | 7,550.45 | -0.39% |
| ASE Index (Jordan) | 4,098.86 | -0.40% |
| Bahrain All Share (Bahrain) | 1,911.97 | -0.42% |
| Tadawul All Share (Saudi Arabia) | 10,681.82 | -0.63% |
| EGX 30 (Egypt) | 54,994.31 | -0.68% |
| FTSE ADX General (Abu Dhabi) | 10,106.07 | -1.61% |
Carried whole from our Middle East Market Wrap of 21 September 2026, closes of Monday 21 September on the basis published there, stacked gainers then losers; the Dubai change is the exchange’s own daily figure and the Qatar and Amman changes are our calculations, as published.
Europe reference
| Index | Close | Change |
|---|---|---|
| FTSE MIB (Italy) | 52,371.54 | +1.60% |
| Euro Stoxx 50 (euro area) | 6,318.05 | +1.31% |
| SMI (Switzerland) | 13,956.58 | +1.23% |
| IBEX 35 (Spain) | 19,724.40 | +1.08% |
| DAX (Germany), Xetra close | 25,575.01 | +1.07% |
| Stoxx Europe 600 (Europe) | 642.07 | +1.04% |
| CAC 40 (France) | 8,138.94 | +0.92% |
| FTSE 100 (United Kingdom) | 10,739.01 | +0.75% |
| AEX (Netherlands) | 1,102.35 | +0.66% |
Carried whole from our Europe Market Wrap of 21 September 2026, closes of Monday 21 September on the basis published there; the DAX row is the exchange’s official closing price, and the Stoxx Europe 600 and Euro Stoxx 50 rows are the administrator’s 17:30 CET prints, checked against its finals at our next capture.
Why it matters: the record close rests on the oil column, on our reading: crude’s fourth straight losing settlement pulled the long end of the Treasury curve 5 basis points lower, and the sectors that price duration and growth, communication services, technology and discretionary, did the day’s work while energy took the day’s only deep fall. The two notes the network carried frame the argument the week will test: Yardeni reads higher for longer energy as a case for further tightening, while the LPL line has Warsh’s committee conditioning its outlook on oil settling down, and Monday’s session traded the second reading. Across everything we published today, the day’s best index is the Nasdaq 100 at 2.83 percent higher and the worst Abu Dhabi’s FTSE ADX General at 1.61 percent lower, on our count, and the S&P 500’s rise is its third straight, on our count.
Outlook: Tuesday’s sessions from Asia through Europe trade the record close and the oil slide, with Tokyo shut until Thursday, when the Bank of Japan’s rise takes effect. The Trump and Xi summit this week, covering artificial intelligence, tariffs and critical minerals per the network’s closing report, and Trump’s possible meeting with Iran’s president at the General Assembly sit over every board, and for this one the test is whether a record built on cheaper oil holds if the barrel stops falling.
Sources: US Department of the Treasury, CNBC, The Edge.